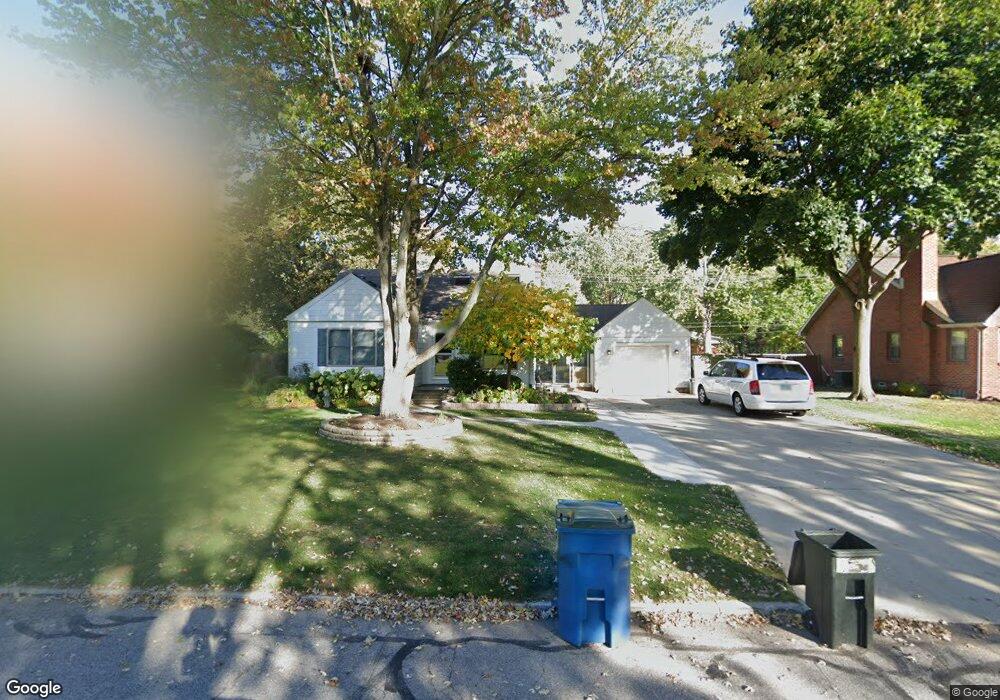
5830 Highland View Dr Sylvania, OH 43560
Estimated Value: $207,000 - $238,000
3
Beds
1
Bath
1,336
Sq Ft
$166/Sq Ft
Est. Value
About This Home
This home is located at 5830 Highland View Dr, Sylvania, OH 43560 and is currently estimated at $221,833, approximately $166 per square foot. 5830 Highland View Dr is a home located in Lucas County with nearby schools including Maplewood Elementary School, Sylvania Arbor Hills Junior High School, and Sylvania Northview High School.
Ownership History
Date
Name
Owned For
Owner Type
Purchase Details
Closed on
Jun 30, 2017
Sold by
Hess Gwendolyn L
Bought by
Hadeed Carollyn G and Hadeed Thomas T
Current Estimated Value
Purchase Details
Closed on
Mar 8, 2011
Sold by
Hadeed Thomas T and Hadeed Carolyn G
Bought by
Hadeed Carolyn G
Purchase Details
Closed on
May 29, 2002
Sold by
Hadeed Tofe J Tr
Bought by
Hadeed Thomas T and Hadeed Carolyn G
Home Financials for this Owner
Home Financials are based on the most recent Mortgage that was taken out on this home.
Original Mortgage
$73,000
Outstanding Balance
$29,779
Interest Rate
6.87%
Mortgage Type
Purchase Money Mortgage
Estimated Equity
$192,054
Purchase Details
Closed on
Dec 23, 1993
Sold by
Hadeed Tofe J
Purchase Details
Closed on
Jul 14, 1992
Purchase Details
Closed on
Jan 20, 1989
Sold by
Haviland Bryan L
Create a Home Valuation Report for This Property
The Home Valuation Report is an in-depth analysis detailing your home's value as well as a comparison with similar homes in the area
Home Values in the Area
Average Home Value in this Area
Purchase History
| Date | Buyer | Sale Price | Title Company |
|---|---|---|---|
| Hadeed Carollyn G | $38,500 | None Available | |
| Hadeed Carolyn G | -- | Attorney | |
| Hadeed Thomas T | $91,300 | -- | |
| -- | -- | -- | |
| -- | $78,500 | -- | |
| -- | $66,500 | -- |
Source: Public Records
Mortgage History
| Date | Status | Borrower | Loan Amount |
|---|---|---|---|
| Open | Hadeed Thomas T | $73,000 |
Source: Public Records
Tax History
| Year | Tax Paid | Tax Assessment Tax Assessment Total Assessment is a certain percentage of the fair market value that is determined by local assessors to be the total taxable value of land and additions on the property. | Land | Improvement |
|---|---|---|---|---|
| 2025 | -- | $60,865 | $13,825 | $47,040 |
| 2024 | $1,945 | $60,865 | $13,825 | $47,040 |
| 2023 | $3,159 | $42,805 | $12,215 | $30,590 |
| 2022 | $3,163 | $42,805 | $12,215 | $30,590 |
| 2021 | $3,239 | $42,805 | $12,215 | $30,590 |
| 2020 | $3,422 | $40,285 | $8,820 | $31,465 |
| 2019 | $3,292 | $40,285 | $8,820 | $31,465 |
| 2018 | $3,274 | $40,285 | $8,820 | $31,465 |
| 2017 | $3,523 | $39,375 | $8,610 | $30,765 |
| 2016 | $3,453 | $112,500 | $24,600 | $87,900 |
| 2015 | $3,250 | $112,500 | $24,600 | $87,900 |
| 2014 | $2,995 | $37,880 | $8,300 | $29,580 |
| 2013 | $2,995 | $37,880 | $8,300 | $29,580 |
Source: Public Records
Map
Nearby Homes
- 6739 Erie St
- 6748 Green Rd
- 5804 Summit St
- 6946 Kinsman Dr
- 5310 Turnberry Ln
- 6 Bent Creek Crossing
- 7864 Saltwood Ct
- 5462 Deercross Ct
- 6584 Brint Rd
- 7548 Red Pines Dr
- 5102 Sprucewood Ct
- 6548 Cornwall Ct
- 8118 Erie St
- 4854 Wickford Dr E Unit 2
- 7243 Ridgeland Rd
- 5519 Willow Cir
- 4736 Wickford Dr W
- 4639 Tamworth Rd
- 6853 Fredericksburg Dr
- 4735 King Rd
- 5826 Highland View Dr
- 5820 Highland View Dr
- 5840 Highland View Dr
- 5827 Brainard Dr
- 5819 Brainard Dr
- 5835 Brainard Dr
- 5825 Highland View Dr
- 5850 Highland View Dr
- 5800 Highland View Dr
- 7104 San Benito Dr
- 5843 Brainard Dr
- 7110 San Benito Dr
- 5856 Highland View Dr
- 7104 Erie St
- 5803 Brainard Dr
- 5851 Brainard Dr
- 7116 San Benito Dr
- 7115 San Benito Dr
- 7110 Erie St
- 5867 Highland View Dr
Your Personal Tour Guide
Ask me questions while you tour the home.