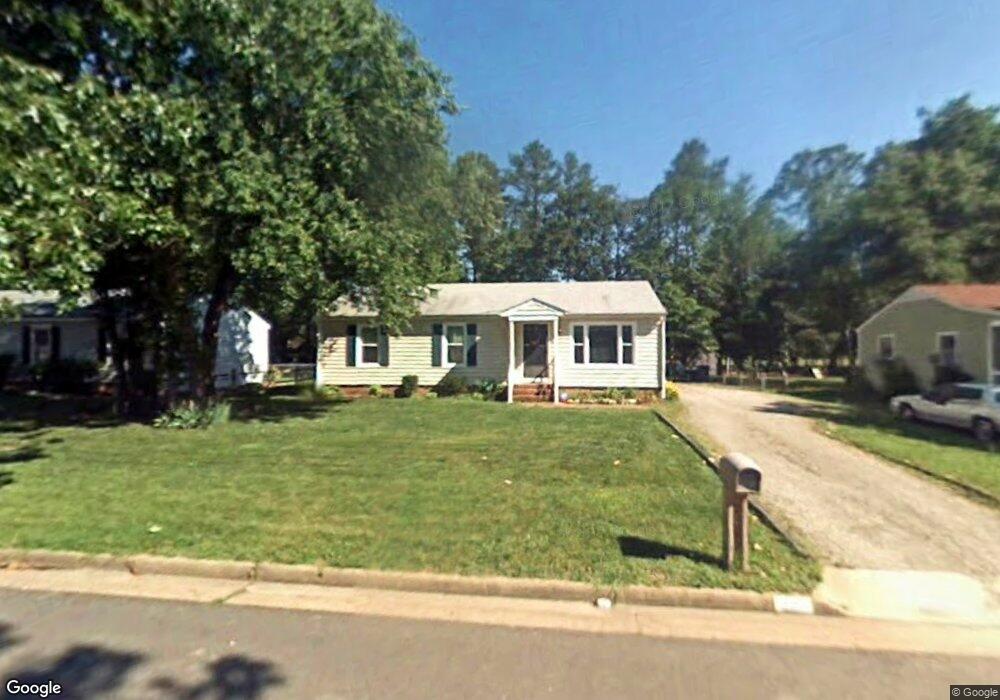
5830 Retriever Rd North Chesterfield, VA 23237
Estimated Value: $253,000 - $295,000
3
Beds
1
Bath
1,300
Sq Ft
$216/Sq Ft
Est. Value
About This Home
This home is located at 5830 Retriever Rd, North Chesterfield, VA 23237 and is currently estimated at $280,427, approximately $215 per square foot. 5830 Retriever Rd is a home located in Chesterfield County with nearby schools including Salem Church Elementary School, Salem Church Middle School, and Lloyd C Bird High School.
Ownership History
Date
Name
Owned For
Owner Type
Purchase Details
Closed on
Apr 27, 2021
Sold by
Fry Peggy A
Bought by
Malvern Construction Corp
Current Estimated Value
Purchase Details
Closed on
Jan 25, 1999
Sold by
Hundley Gerald H
Bought by
Fry
Home Financials for this Owner
Home Financials are based on the most recent Mortgage that was taken out on this home.
Original Mortgage
$72,089
Interest Rate
6.7%
Mortgage Type
FHA
Purchase Details
Closed on
Dec 20, 1996
Sold by
Sobrito Steven P
Bought by
Hundley Gerald H and Hundley Brenda J
Home Financials for this Owner
Home Financials are based on the most recent Mortgage that was taken out on this home.
Original Mortgage
$68,289
Interest Rate
7.62%
Mortgage Type
VA
Create a Home Valuation Report for This Property
The Home Valuation Report is an in-depth analysis detailing your home's value as well as a comparison with similar homes in the area
Home Values in the Area
Average Home Value in this Area
Purchase History
| Date | Buyer | Sale Price | Title Company |
|---|---|---|---|
| Malvern Construction Corp | $180,000 | Attorney | |
| Malvern Construction Corp | -- | None Listed On Document | |
| Fry | $72,000 | -- | |
| Hundley Gerald H | $67,000 | -- |
Source: Public Records
Mortgage History
| Date | Status | Borrower | Loan Amount |
|---|---|---|---|
| Previous Owner | Hundley Gerald H | $72,089 | |
| Previous Owner | Hundley Gerald H | $68,289 |
Source: Public Records
Tax History Compared to Growth
Tax History
| Year | Tax Paid | Tax Assessment Tax Assessment Total Assessment is a certain percentage of the fair market value that is determined by local assessors to be the total taxable value of land and additions on the property. | Land | Improvement |
|---|---|---|---|---|
| 2025 | $2,310 | $256,700 | $55,000 | $201,700 |
| 2024 | $2,310 | $251,900 | $55,000 | $196,900 |
| 2023 | $1,995 | $219,200 | $50,000 | $169,200 |
| 2022 | $1,968 | $213,900 | $45,000 | $168,900 |
| 2021 | $1,740 | $178,400 | $40,000 | $138,400 |
| 2020 | $1,534 | $161,500 | $40,000 | $121,500 |
| 2019 | $1,493 | $157,200 | $40,000 | $117,200 |
| 2018 | $1,370 | $142,100 | $38,000 | $104,100 |
| 2017 | $1,339 | $134,300 | $36,000 | $98,300 |
| 2016 | $1,224 | $127,500 | $36,000 | $91,500 |
| 2015 | $1,282 | $130,900 | $36,000 | $94,900 |
| 2014 | $1,258 | $128,400 | $36,000 | $92,400 |
Source: Public Records
Map
Nearby Homes
- 8625 Watchhaven Ln
- 5606 Retriever Rd
- 8906 Huntingcreek Place
- 6231 Huntingcreek Dr
- The Audobon Plan at Reedy Springs
- The Dogwood Plan at Reedy Springs
- The Bradford Plan at Reedy Springs
- The Portsmouth Plan at Reedy Springs
- The Hamlin Plan at Reedy Springs
- The Azalea Plan at Reedy Springs
- The Shenandoah Plan at Reedy Springs
- The Harvick Plan at Reedy Springs
- The Magnolia Plan at Reedy Springs
- The Maple Plan at Reedy Springs
- The Burton Plan at Reedy Springs
- The Savannah Plan at Reedy Springs
- The Busch Plan at Reedy Springs
- The Rosewood Plan at Reedy Springs
- 5985 Sara Kay Dr
- 5974 Sara Kay Dr
- 5824 Retriever Rd
- 5836 Retriever Rd
- 5818 Retriever Rd
- 5842 Retriever Rd
- 5829 Retriever Rd
- 5835 Retriever Rd
- 5823 Retriever Rd
- 5812 Retriever Rd
- 5848 Retriever Rd
- 5841 Retriever Rd
- 5817 Retriever Rd
- 8605 Gunsight Ln
- 5811 Retriever Rd
- 5806 Retriever Rd
- 5900 Retriever Rd
- 5804 Gunsight Ct
- 5802 Gunsight Ct
- 8611 Gunsight Ln
- 5806 Gunsight Ct
- 8600 Gunsight Ln