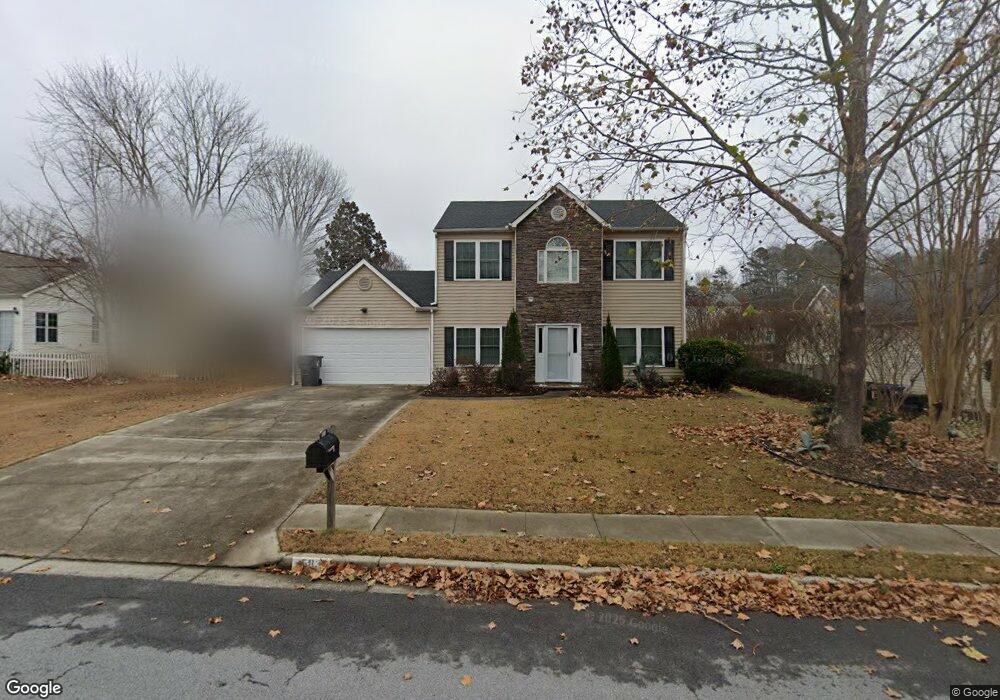
5831 Stephens Oak Ct Unit A Sugar Hill, GA 30518
Estimated Value: $385,000 - $409,000
3
Beds
3
Baths
1,860
Sq Ft
$216/Sq Ft
Est. Value
About This Home
This home is located at 5831 Stephens Oak Ct Unit A, Sugar Hill, GA 30518 and is currently estimated at $401,068, approximately $215 per square foot. 5831 Stephens Oak Ct Unit A is a home located in Gwinnett County with nearby schools including Sycamore Elementary School, Lanier Middle School, and Lanier High School.
Ownership History
Date
Name
Owned For
Owner Type
Purchase Details
Closed on
Dec 30, 2016
Sold by
Myers Kyle
Bought by
Nevarez Vanessa
Current Estimated Value
Home Financials for this Owner
Home Financials are based on the most recent Mortgage that was taken out on this home.
Original Mortgage
$190,000
Outstanding Balance
$155,629
Interest Rate
4.08%
Mortgage Type
New Conventional
Estimated Equity
$245,439
Purchase Details
Closed on
Dec 4, 2015
Sold by
Kunkle James W
Bought by
Myers Kyle and Myers April
Home Financials for this Owner
Home Financials are based on the most recent Mortgage that was taken out on this home.
Original Mortgage
$143,900
Interest Rate
3.91%
Mortgage Type
FHA
Purchase Details
Closed on
Aug 19, 1999
Sold by
Homeland Legacy Inc
Bought by
Kunkle James W
Home Financials for this Owner
Home Financials are based on the most recent Mortgage that was taken out on this home.
Original Mortgage
$144,121
Interest Rate
7.58%
Mortgage Type
FHA
Create a Home Valuation Report for This Property
The Home Valuation Report is an in-depth analysis detailing your home's value as well as a comparison with similar homes in the area
Home Values in the Area
Average Home Value in this Area
Purchase History
| Date | Buyer | Sale Price | Title Company |
|---|---|---|---|
| Nevarez Vanessa | $200,000 | -- | |
| Myers Kyle | $179,900 | -- | |
| Kunkle James W | $144,200 | -- |
Source: Public Records
Mortgage History
| Date | Status | Borrower | Loan Amount |
|---|---|---|---|
| Open | Nevarez Vanessa | $190,000 | |
| Previous Owner | Myers Kyle | $143,900 | |
| Previous Owner | Kunkle James W | $144,121 |
Source: Public Records
Tax History Compared to Growth
Tax History
| Year | Tax Paid | Tax Assessment Tax Assessment Total Assessment is a certain percentage of the fair market value that is determined by local assessors to be the total taxable value of land and additions on the property. | Land | Improvement |
|---|---|---|---|---|
| 2025 | $4,188 | $151,280 | $40,000 | $111,280 |
| 2024 | $3,969 | $134,240 | $32,400 | $101,840 |
| 2023 | $3,969 | $134,240 | $32,400 | $101,840 |
| 2022 | $3,633 | $119,720 | $22,000 | $97,720 |
| 2021 | $3,041 | $89,240 | $18,000 | $71,240 |
| 2020 | $2,996 | $86,280 | $18,000 | $68,280 |
| 2019 | $2,905 | $86,280 | $18,000 | $68,280 |
| 2018 | $2,679 | $75,840 | $14,000 | $61,840 |
| 2016 | $2,789 | $70,440 | $14,000 | $56,440 |
| 2015 | $2,006 | $55,800 | $9,600 | $46,200 |
| 2014 | $2,015 | $55,800 | $9,600 | $46,200 |
Source: Public Records
Map
Nearby Homes
- 5840 Stephens Mill Dr
- 5730 Arbor Green Cir
- 818 Pond View Ct
- 5671 Arbor Green Cir
- 915 Riverside Rd Unit 3
- 598 Austin Creek Dr
- 778 Austin Creek Dr
- 5828 Paliser Trace
- 5605 Austin Garner Rd
- 965 Sugar Meadow Dr
- 779 Avonley Creek Trace
- 978 Sugar Vista Cir
- 585 Emerald Pkwy
- 5650 Princeton Oaks Dr
- 5680 Princeton Oaks Dr
- 6377 Barker Station Walk NE
- 5821 Stephens Oak Ct Unit 1
- 847 Stephens Oak Dr
- 857 Stephens Oak Dr
- 5860 Stephens Mill Dr
- 857 857 Stephens Oak Ln
- 5850 Stephens Mill Dr Unit 1
- 867 Stephens Oak Dr
- 5811 Stephens Oak Ct
- 5828 Stephens Oak Ct
- 5838 Stephens Oak Ct
- 5848 Stephens Oak Ct
- 5848 Stephens Oak Ct Unit I
- 0 Stephens Oak Ct Unit 8611795
- 0 Stephens Oak Ct Unit 8137362
- 827 Stephens Oak Dr
- 5818 Stephens Oak Ct Unit 1
- 5801 Stephens Oak Ct
- 844 Stephens Oak Dr
- 5808 Stephens Oak Ct
- 5830 Stephens Mill Dr Unit 31