Estimated Value: $333,000 - $362,000
4
Beds
1
Bath
1,518
Sq Ft
$231/Sq Ft
Est. Value
About This Home
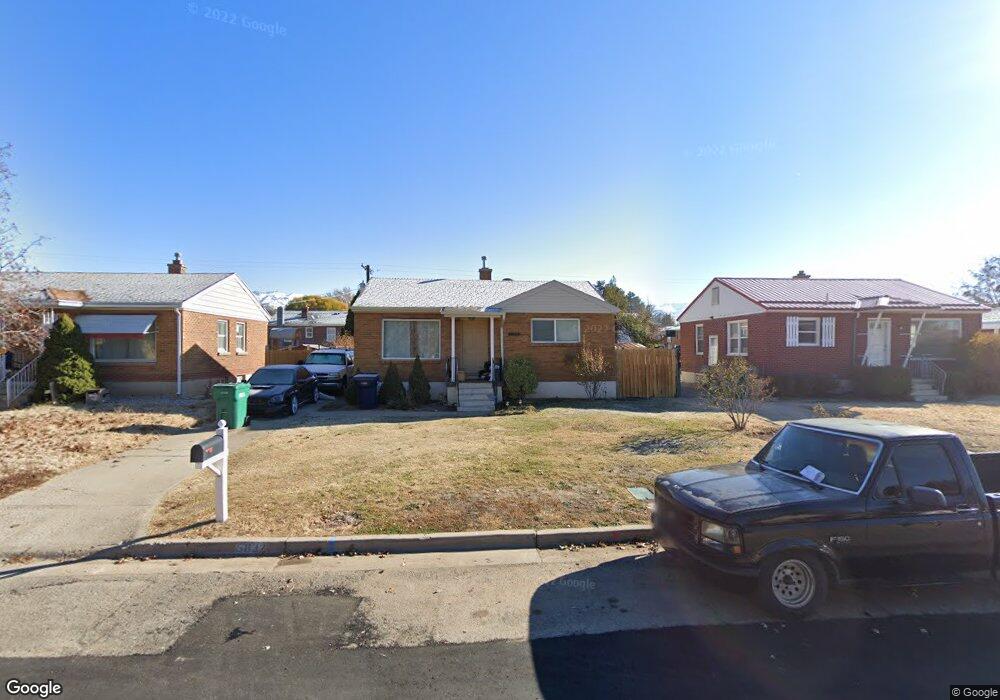
This home is located at 5832 S 2625 W, Roy, UT 84067 and is currently estimated at $350,470, approximately $230 per square foot. 5832 S 2625 W is a home located in Weber County with nearby schools including Roy Elementary School, Roy Junior High School, and Roy High School.
Ownership History
Date
Name
Owned For
Owner Type
Purchase Details
Closed on
Nov 4, 2019
Sold by
Green Shari
Bought by
Castaneda Jesus Edel
Current Estimated Value
Home Financials for this Owner
Home Financials are based on the most recent Mortgage that was taken out on this home.
Original Mortgage
$198,341
Outstanding Balance
$175,007
Interest Rate
3.75%
Mortgage Type
FHA
Estimated Equity
$175,463
Purchase Details
Closed on
May 3, 2018
Sold by
Puffer Chaz L and Puffer Ahnica M
Bought by
Green Shari
Home Financials for this Owner
Home Financials are based on the most recent Mortgage that was taken out on this home.
Original Mortgage
$184,594
Interest Rate
5.5%
Mortgage Type
FHA
Purchase Details
Closed on
Feb 9, 1996
Sold by
Francis Ralph William and Francis John Hyrum
Bought by
Fowers Melvin F and Fowers Jeaniene T
Create a Home Valuation Report for This Property
The Home Valuation Report is an in-depth analysis detailing your home's value as well as a comparison with similar homes in the area
Home Values in the Area
Average Home Value in this Area
Purchase History
| Date | Buyer | Sale Price | Title Company |
|---|---|---|---|
| Castaneda Jesus Edel | -- | Us Title Insurance Agency | |
| Green Shari | -- | Stewart Title Ins Agcy Of Ut | |
| Fowers Melvin F | -- | Associated Title |
Source: Public Records
Mortgage History
| Date | Status | Borrower | Loan Amount |
|---|---|---|---|
| Open | Castaneda Jesus Edel | $198,341 | |
| Previous Owner | Green Shari | $184,594 |
Source: Public Records
Tax History Compared to Growth
Tax History
| Year | Tax Paid | Tax Assessment Tax Assessment Total Assessment is a certain percentage of the fair market value that is determined by local assessors to be the total taxable value of land and additions on the property. | Land | Improvement |
|---|---|---|---|---|
| 2025 | $2,070 | $318,429 | $99,993 | $218,436 |
| 2024 | $2,015 | $171,599 | $56,212 | $115,387 |
| 2023 | $1,880 | $159,500 | $55,612 | $103,888 |
| 2022 | $2,148 | $191,400 | $52,317 | $139,083 |
| 2021 | $1,738 | $253,000 | $61,483 | $191,517 |
| 2020 | $1,518 | $201,000 | $61,483 | $139,517 |
| 2019 | $1,505 | $188,000 | $37,193 | $150,807 |
| 2018 | $1,189 | $135,000 | $32,394 | $102,606 |
| 2017 | $1,101 | $116,000 | $32,394 | $83,606 |
| 2016 | $1,065 | $60,268 | $18,184 | $42,084 |
| 2015 | $987 | $56,760 | $20,830 | $35,930 |
| 2014 | $923 | $51,735 | $15,517 | $36,218 |
Source: Public Records
Map
Nearby Homes
- 2587 W 5750 S
- 2672 W 5750 S
- 2571 W 5725 S
- 5810 S 2550 W
- 2829 W 5925 S
- 2646 W 5625 S Unit M-2646
- 2907 W 5775 S
- 5568 S 2800 W Unit 5B
- 2778 W 5550 S Unit 28
- 2995 W 5750 S
- 2786 W 5550 S Unit C11
- 3027 W 2600 N
- 3033 W 2600 N
- 3068 W 2600 N
- 484 W 2650 N
- 480 W 2650 N
- 2635 N 500 W Unit 45
- 2612 N 525 W
- 5643 S 2200 W
- 3009 W 6000 S