Estimated Value: $416,718 - $455,000
5
Beds
2
Baths
2,044
Sq Ft
$211/Sq Ft
Est. Value
About This Home
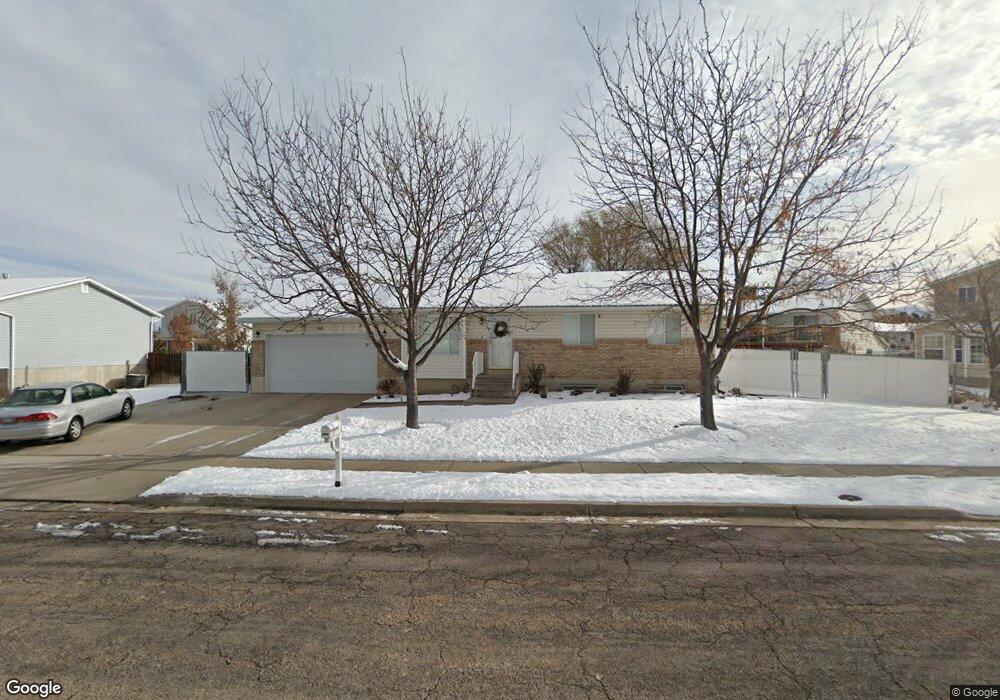
This home is located at 5832 S 4025 W, Roy, UT 84067 and is currently estimated at $431,180, approximately $210 per square foot. 5832 S 4025 W is a home located in Weber County with nearby schools including Freedom School, Roy Junior High School, and Roy High School.
Ownership History
Date
Name
Owned For
Owner Type
Purchase Details
Closed on
Apr 2, 2020
Sold by
Huff Nathan C and Huff Holly
Bought by
Huff Holly and Huff Nathan Carl
Current Estimated Value
Purchase Details
Closed on
Apr 19, 2005
Sold by
Thompson Andrew J
Bought by
Huff Nathan C
Home Financials for this Owner
Home Financials are based on the most recent Mortgage that was taken out on this home.
Original Mortgage
$128,877
Outstanding Balance
$66,765
Interest Rate
5.84%
Mortgage Type
FHA
Estimated Equity
$364,415
Purchase Details
Closed on
Mar 18, 2002
Sold by
Field Michelle D
Bought by
Field Wayne A
Purchase Details
Closed on
Sep 2, 1999
Sold by
Lenz Stephen F and Lenz Marla T
Bought by
Field Wayne A
Home Financials for this Owner
Home Financials are based on the most recent Mortgage that was taken out on this home.
Original Mortgage
$111,125
Interest Rate
7.47%
Mortgage Type
FHA
Create a Home Valuation Report for This Property
The Home Valuation Report is an in-depth analysis detailing your home's value as well as a comparison with similar homes in the area
Home Values in the Area
Average Home Value in this Area
Purchase History
| Date | Buyer | Sale Price | Title Company |
|---|---|---|---|
| Huff Holly | -- | Accommodation | |
| Huff Nathan C | -- | First American Title | |
| Field Wayne A | -- | -- | |
| Field Wayne A | -- | Bonneville Title Company |
Source: Public Records
Mortgage History
| Date | Status | Borrower | Loan Amount |
|---|---|---|---|
| Open | Huff Nathan C | $128,877 | |
| Previous Owner | Field Wayne A | $111,125 |
Source: Public Records
Tax History Compared to Growth
Tax History
| Year | Tax Paid | Tax Assessment Tax Assessment Total Assessment is a certain percentage of the fair market value that is determined by local assessors to be the total taxable value of land and additions on the property. | Land | Improvement |
|---|---|---|---|---|
| 2025 | $2,399 | $425,058 | $140,781 | $284,277 |
| 2024 | $2,320 | $227,699 | $77,437 | $150,262 |
| 2023 | $2,198 | $216,150 | $68,292 | $147,858 |
| 2022 | $2,460 | $246,401 | $62,409 | $183,992 |
| 2021 | $1,841 | $306,000 | $82,413 | $223,587 |
| 2020 | $1,675 | $255,000 | $82,413 | $172,587 |
| 2019 | $1,732 | $249,000 | $47,055 | $201,945 |
| 2018 | $1,611 | $219,000 | $41,937 | $177,063 |
| 2017 | $1,491 | $191,000 | $41,937 | $149,063 |
| 2016 | $1,411 | $97,519 | $22,192 | $75,327 |
| 2015 | $1,203 | $85,748 | $22,192 | $63,556 |
| 2014 | $1,167 | $82,245 | $19,497 | $62,748 |
Source: Public Records
Map
Nearby Homes