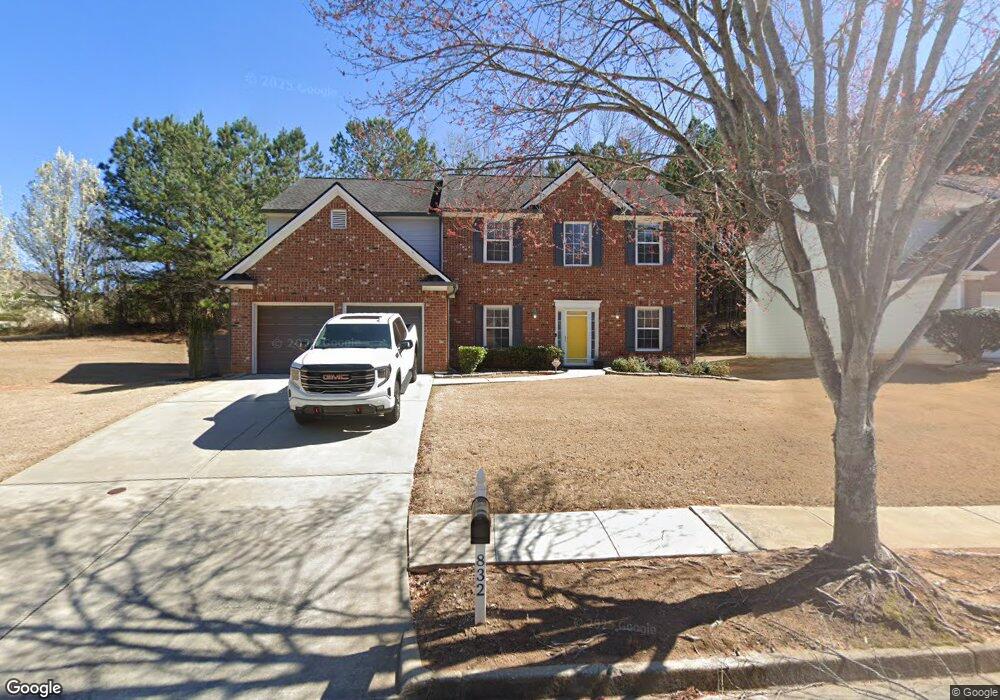
5832 Village Loop Fairburn, GA 30213
Estimated Value: $311,000 - $333,182
4
Beds
3
Baths
2,511
Sq Ft
$128/Sq Ft
Est. Value
About This Home
This home is located at 5832 Village Loop, Fairburn, GA 30213 and is currently estimated at $320,296, approximately $127 per square foot. 5832 Village Loop is a home located in Fulton County with nearby schools including Renaissance Elementary School, Renaissance Middle School, and Langston Hughes High School.
Ownership History
Date
Name
Owned For
Owner Type
Purchase Details
Closed on
May 23, 2011
Sold by
Branch Bkng & Trust Co
Bought by
Jefferson Homes Inc
Current Estimated Value
Home Financials for this Owner
Home Financials are based on the most recent Mortgage that was taken out on this home.
Original Mortgage
$124,150
Interest Rate
4.65%
Purchase Details
Closed on
Dec 30, 2003
Sold by
Dmsm Llc
Bought by
Sharon Mcswain Homes Inc
Home Financials for this Owner
Home Financials are based on the most recent Mortgage that was taken out on this home.
Original Mortgage
$179,200
Interest Rate
5.82%
Mortgage Type
VA
Purchase Details
Closed on
Dec 22, 2003
Sold by
Dmsm Llc
Bought by
Penn Charles
Home Financials for this Owner
Home Financials are based on the most recent Mortgage that was taken out on this home.
Original Mortgage
$179,200
Interest Rate
5.82%
Mortgage Type
VA
Create a Home Valuation Report for This Property
The Home Valuation Report is an in-depth analysis detailing your home's value as well as a comparison with similar homes in the area
Home Values in the Area
Average Home Value in this Area
Purchase History
| Date | Buyer | Sale Price | Title Company |
|---|---|---|---|
| Jefferson Homes Inc | -- | -- | |
| Sharon Mcswain Homes Inc | -- | -- | |
| Penn Charles | $182,500 | -- |
Source: Public Records
Mortgage History
| Date | Status | Borrower | Loan Amount |
|---|---|---|---|
| Closed | Jefferson Homes Inc | $124,150 | |
| Previous Owner | Penn Charles | $179,200 |
Source: Public Records
Tax History
| Year | Tax Paid | Tax Assessment Tax Assessment Total Assessment is a certain percentage of the fair market value that is determined by local assessors to be the total taxable value of land and additions on the property. | Land | Improvement |
|---|---|---|---|---|
| 2025 | $1,684 | $117,680 | $36,520 | $81,160 |
| 2023 | $3,645 | $129,120 | $31,160 | $97,960 |
| 2022 | $1,506 | $83,560 | $16,360 | $67,200 |
| 2021 | $1,411 | $73,720 | $14,320 | $59,400 |
| 2020 | $1,415 | $72,800 | $14,120 | $58,680 |
| 2019 | $1,677 | $71,520 | $13,880 | $57,640 |
| 2018 | $1,803 | $62,600 | $11,800 | $50,800 |
| 2017 | $1,073 | $43,400 | $10,200 | $33,200 |
| 2016 | $1,071 | $43,400 | $10,200 | $33,200 |
| 2015 | $1,075 | $43,400 | $10,200 | $33,200 |
| 2014 | $1,107 | $43,400 | $10,200 | $33,200 |
Source: Public Records
Map
Nearby Homes
- 7899 Village Pass
- 7789 Village Pass
- 5745 Village Loop
- 5665 Valley Loop
- 5896 Village Loop
- 545 Tuscan Cove
- 5334 Tolar Rd
- 5372 Tolar Rd Unit 78
- 5430 Bethlehem Rd
- 5364 Tolar Rd Unit 74
- 5372 Rd
- 5371 Rd
- 5366 Rd
- 7308 Tolar Rd
- 7308 Tolar Rd Unit 40
- 7310 Tolar Rd
- 7312 Tolar Rd
- 5363 Tolar Lot 49 Rd
- 5359 Tolar Lot 51 Rd
- 5346 Tolar Lot 65 Rd
- 5834 Village Loop
- 7696 Overlook Bend
- 5836 Village Loop
- 5467 Babbling View
- 5477 Babbling View
- 7698 Overlook Bend
- 5838 Village Loop
- 5487 Babbling View
- 5833 Village Loop
- 5835 Village Loop
- 7982 Overlook Bend
- 5840 Village Loop
- 5497 Babbling View
- 7699 Overlook Bend
- 5837 Village Loop
- 5827 Village Loop
- 7695 Overlook Bend
- 5839 Village Loop
- 5507 Babbling View
- 5507 Babbling View
Your Personal Tour Guide
Ask me questions while you tour the home.