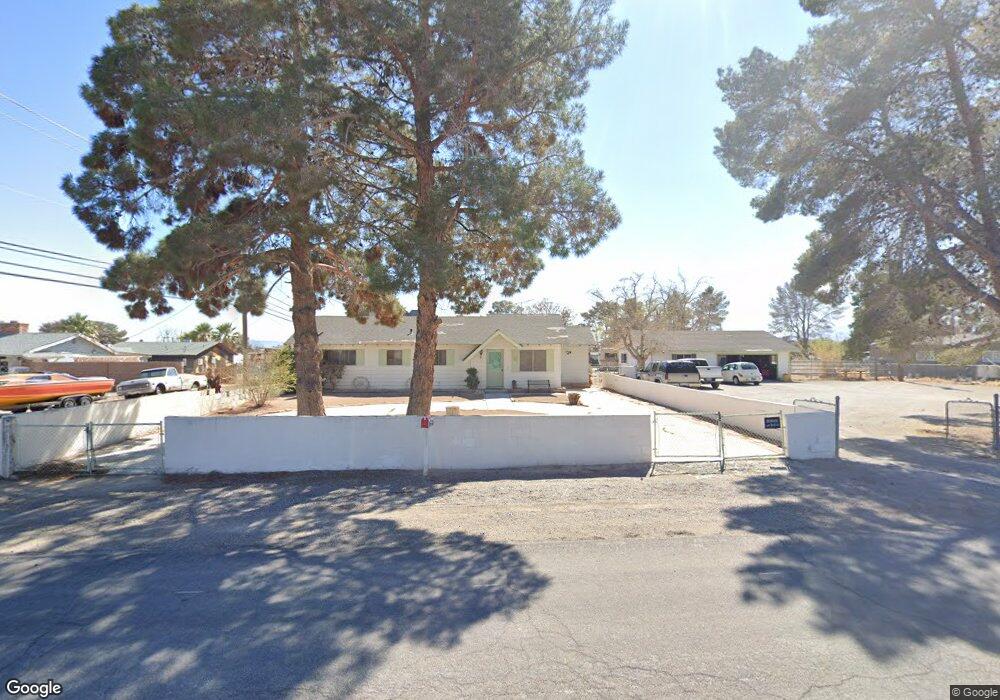
5833 W La Madre Way Las Vegas, NV 89130
North Cheyenne NeighborhoodEstimated Value: $571,000 - $600,000
2
Beds
2
Baths
1,580
Sq Ft
$369/Sq Ft
Est. Value
About This Home
This home is located at 5833 W La Madre Way, Las Vegas, NV 89130 and is currently estimated at $583,271, approximately $369 per square foot. 5833 W La Madre Way is a home located in Clark County with nearby schools including Ernest May Elementary School, Theron L Swainston Middle School, and Shadow Ridge High School.
Ownership History
Date
Name
Owned For
Owner Type
Purchase Details
Closed on
Mar 25, 2011
Sold by
Politowski Charles
Bought by
Politowski Kathleen Renee
Current Estimated Value
Purchase Details
Closed on
Mar 11, 2002
Sold by
Politowski Kathleen
Bought by
Politowski Charles
Home Financials for this Owner
Home Financials are based on the most recent Mortgage that was taken out on this home.
Original Mortgage
$174,400
Interest Rate
6.94%
Purchase Details
Closed on
Mar 2, 2002
Sold by
Rodriguez Arthur N and Rodriguez Maryann M
Bought by
Politowski Charles
Home Financials for this Owner
Home Financials are based on the most recent Mortgage that was taken out on this home.
Original Mortgage
$174,400
Interest Rate
6.94%
Purchase Details
Closed on
May 12, 1994
Sold by
Giles Dean F and Giles Marianna
Bought by
Rodriguez Arthur N and Rodriguez Maryann M
Home Financials for this Owner
Home Financials are based on the most recent Mortgage that was taken out on this home.
Original Mortgage
$133,200
Interest Rate
8.83%
Create a Home Valuation Report for This Property
The Home Valuation Report is an in-depth analysis detailing your home's value as well as a comparison with similar homes in the area
Home Values in the Area
Average Home Value in this Area
Purchase History
| Date | Buyer | Sale Price | Title Company |
|---|---|---|---|
| Politowski Kathleen Renee | -- | Accommodation | |
| Politowski Charles | -- | Nevada Title Company | |
| Politowski Charles | $218,000 | Nevada Title Company | |
| Rodriguez Arthur N | $148,000 | Old Republic Title Company |
Source: Public Records
Mortgage History
| Date | Status | Borrower | Loan Amount |
|---|---|---|---|
| Previous Owner | Politowski Charles | $174,400 | |
| Previous Owner | Rodriguez Arthur N | $133,200 |
Source: Public Records
Tax History Compared to Growth
Tax History
| Year | Tax Paid | Tax Assessment Tax Assessment Total Assessment is a certain percentage of the fair market value that is determined by local assessors to be the total taxable value of land and additions on the property. | Land | Improvement |
|---|---|---|---|---|
| 2025 | $2,311 | $114,148 | $87,500 | $26,648 |
| 2024 | $2,140 | $114,148 | $87,500 | $26,648 |
| 2023 | $2,140 | $100,399 | $76,563 | $23,836 |
| 2022 | $1,982 | $73,736 | $52,500 | $21,236 |
| 2021 | $1,835 | $70,192 | $50,400 | $19,792 |
| 2020 | $1,701 | $66,922 | $47,644 | $19,278 |
| 2019 | $1,594 | $65,323 | $46,778 | $18,545 |
| 2018 | $1,521 | $65,942 | $48,510 | $17,432 |
| 2017 | $2,157 | $65,796 | $48,510 | $17,286 |
| 2016 | $1,425 | $51,339 | $34,650 | $16,689 |
| 2015 | $1,421 | $42,126 | $25,988 | $16,138 |
| 2014 | $1,380 | $40,836 | $24,255 | $16,581 |
Source: Public Records
Map
Nearby Homes
- 5605 Bay Shore Cir
- 5600 Segolilly Cir
- 5620 N Jones Blvd
- 5004 Rancho Bernardo Way
- 4905 Ocean Shores Way
- 5260 N Jones Blvd
- 6105 Sadler Dr
- 5144 Maverick St
- 6225 Minerva Dr
- 5900 Red Umber Ave
- 5876 Filmore Ave
- 5229 Shady Grove Ln
- 4821 Fiesta Lakes St
- 4833 Fiesta Lakes St
- 4801 Fiesta Lakes St
- 5876 Tippin Dr
- 5812 Ventana Dr
- 6300 W La Madre Way
- 4816 Fiesta Lakes St
- 4808 Fiesta Lakes St
- 5831 W La Madre Way
- 6060 W La Madre Way
- 5827 W La Madre Way
- 6050 W Verde Way
- 5950 W Verde Way
- 6070 W Verde Way
- 5821 W La Madre Way
- 6020 W La Madre Way
- 6050 W La Madre Way
- 5900 W Verde Way
- 5815 W La Madre Way
- 5951 W Verde Way
- 5820 W Verde Way
- 6071 W Verde Way
- 5810 W Verde Way
- 5809 W La Madre Way
- 6051 W Verde Way
- 5925 W Rosada Way
- 5800 W Verde Way
- 6099 W Verde Way