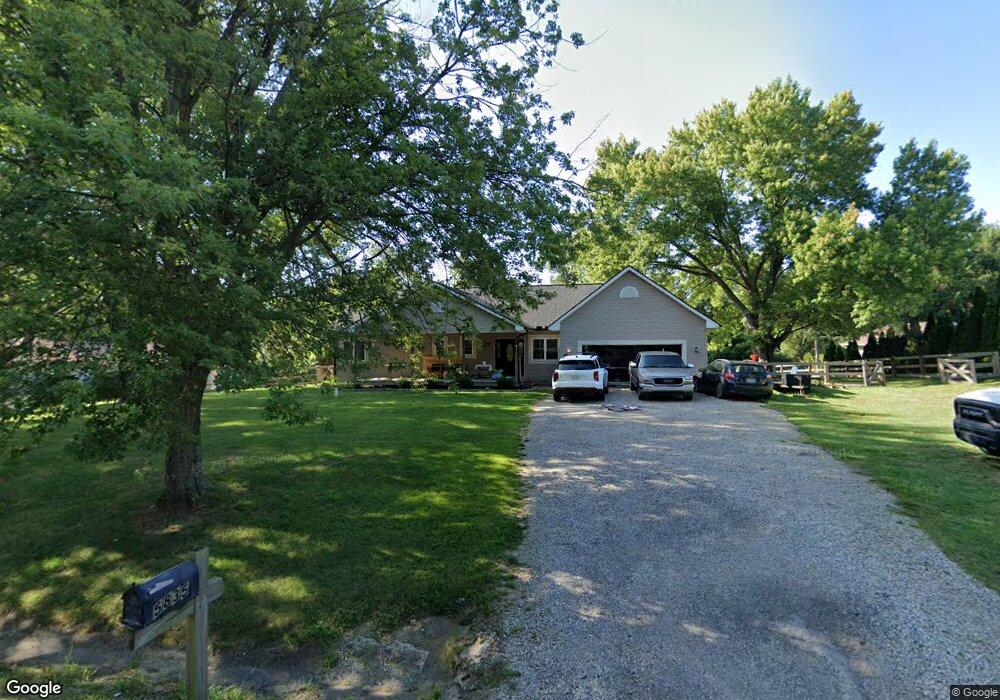
5835 Coonpath Rd Carroll, OH 43112
Bloom NeighborhoodEstimated Value: $323,000 - $357,000
2
Beds
3
Baths
1,354
Sq Ft
$249/Sq Ft
Est. Value
About This Home
This home is located at 5835 Coonpath Rd, Carroll, OH 43112 and is currently estimated at $337,022, approximately $248 per square foot. 5835 Coonpath Rd is a home located in Fairfield County with nearby schools including Bloom Carroll Primary School, Bloom Carroll Intermediate School, and Bloom-Carroll Middle School.
Ownership History
Date
Name
Owned For
Owner Type
Purchase Details
Closed on
Sep 9, 2019
Sold by
Johnston David E
Bought by
Hines Seth M and Hines Paula
Current Estimated Value
Home Financials for this Owner
Home Financials are based on the most recent Mortgage that was taken out on this home.
Original Mortgage
$201,400
Outstanding Balance
$174,467
Interest Rate
3.6%
Mortgage Type
New Conventional
Estimated Equity
$162,555
Purchase Details
Closed on
Jul 23, 2015
Sold by
Bay Vicki L
Bought by
Johnston David E
Purchase Details
Closed on
Nov 26, 2008
Sold by
Mccreary Susan Diane and Estate Of Paul E Underwood
Bought by
Bay Vicki L
Home Financials for this Owner
Home Financials are based on the most recent Mortgage that was taken out on this home.
Original Mortgage
$76,000
Interest Rate
5.19%
Mortgage Type
Purchase Money Mortgage
Create a Home Valuation Report for This Property
The Home Valuation Report is an in-depth analysis detailing your home's value as well as a comparison with similar homes in the area
Home Values in the Area
Average Home Value in this Area
Purchase History
| Date | Buyer | Sale Price | Title Company |
|---|---|---|---|
| Hines Seth M | $212,000 | Great American Title Agency | |
| Johnston David E | $127,000 | Fatco | |
| Bay Vicki L | $100,000 | Attorney |
Source: Public Records
Mortgage History
| Date | Status | Borrower | Loan Amount |
|---|---|---|---|
| Open | Hines Seth M | $201,400 | |
| Previous Owner | Bay Vicki L | $76,000 |
Source: Public Records
Tax History
| Year | Tax Paid | Tax Assessment Tax Assessment Total Assessment is a certain percentage of the fair market value that is determined by local assessors to be the total taxable value of land and additions on the property. | Land | Improvement |
|---|---|---|---|---|
| 2025 | $6,754 | $106,290 | $32,450 | $73,840 |
| 2024 | $6,754 | $83,690 | $21,420 | $62,270 |
| 2023 | $3,509 | $80,410 | $21,420 | $58,990 |
| 2022 | $3,534 | $80,410 | $21,420 | $58,990 |
| 2021 | $2,694 | $60,130 | $16,870 | $43,260 |
| 2020 | $2,445 | $60,130 | $16,870 | $43,260 |
| 2019 | $2,455 | $53,920 | $16,870 | $37,050 |
| 2018 | $2,027 | $34,900 | $11,030 | $23,870 |
| 2017 | $1,901 | $45,730 | $19,470 | $26,260 |
| 2016 | $1,844 | $45,730 | $19,470 | $26,260 |
| 2015 | $1,895 | $44,580 | $19,470 | $25,110 |
| 2014 | $1,813 | $44,580 | $19,470 | $25,110 |
| 2013 | $1,813 | $44,580 | $19,470 | $25,110 |
Source: Public Records
Map
Nearby Homes
- 3540 Carroll-Southern Rd NW
- 3510 Kauffman Rd NW
- 2115 Lamb Rd NW
- 2291 Carroll-Southern Rd NW
- 2155 Carroll-Southern Rd NW
- 52 W Canal St
- 50 Market St
- 7195 Alspach Rd NW
- 5341 Carnes Rd NW
- 5699 Feldon Ct NW
- 3355 Old Columbus Rd NW
- 8322 Benson Rd
- 10 Mount Zion Rd NW
- 3076 Lithopolis Rd NW
- 6985 Royalton Rd SW
- 5840 High St NW
- 55 Betz Rd SW
- 7835 E Ohio State Ln NW
- 2270 Ginder Rd NW
- 681 Mount Zion Rd SW
- 5835 Coonpath Rd NW
- 5795 Coonpath Rd NW
- 5875 Coonpath Rd
- 5795 Coonpath Rd
- 5860 Coonpath Rd
- 5775 Coonpath Rd
- 5800 Coonpath Rd
- 5915 Coonpath Rd NW
- 5915 Coonpath Rd
- 5900 Coonpath Rd NW
- 5755 Coonpath Rd
- 5755 Coonpath Rd
- 5900 Coonpath Rd
- 3021 Kauffman Rd
- 5930 Coonpath Rd
- 3061 Kauffman Rd
- 3010 Kauffman Rd NW
- 5715 Coonpath Rd
- 3061 Kauffman Rd NW
- 3010 Kauffman Rd
Your Personal Tour Guide
Ask me questions while you tour the home.