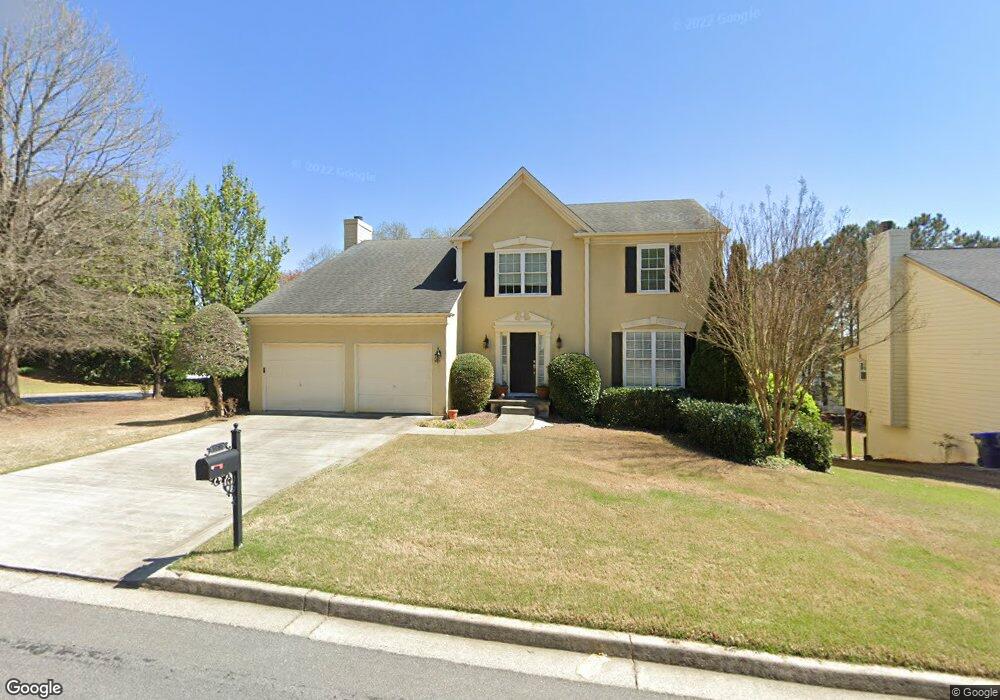
5835 Haterleigh Dr Unit 1 Alpharetta, GA 30005
Wellington NeighborhoodEstimated Value: $562,000 - $611,000
3
Beds
3
Baths
2,236
Sq Ft
$263/Sq Ft
Est. Value
About This Home
This home is located at 5835 Haterleigh Dr Unit 1, Alpharetta, GA 30005 and is currently estimated at $588,450, approximately $263 per square foot. 5835 Haterleigh Dr Unit 1 is a home located in Fulton County with nearby schools including Taylor Road Middle School, Chattahoochee High School, and Cresco Montessori School - Johns Creek Campus.
Ownership History
Date
Name
Owned For
Owner Type
Purchase Details
Closed on
Sep 22, 2006
Sold by
Veeneman Gary W and Veeneman Jean-Marie M
Bought by
Yost Paige H
Current Estimated Value
Home Financials for this Owner
Home Financials are based on the most recent Mortgage that was taken out on this home.
Original Mortgage
$179,000
Outstanding Balance
$106,615
Interest Rate
6.52%
Mortgage Type
New Conventional
Estimated Equity
$481,835
Purchase Details
Closed on
Jun 28, 2002
Sold by
Potts Molly K and Potts Randy L
Bought by
Veeneman Jean and Veeneman Marie M
Home Financials for this Owner
Home Financials are based on the most recent Mortgage that was taken out on this home.
Original Mortgage
$164,000
Interest Rate
6.67%
Mortgage Type
New Conventional
Purchase Details
Closed on
Nov 22, 1996
Sold by
Pulte Home Corp
Bought by
Potts Molly Randy
Create a Home Valuation Report for This Property
The Home Valuation Report is an in-depth analysis detailing your home's value as well as a comparison with similar homes in the area
Home Values in the Area
Average Home Value in this Area
Purchase History
| Date | Buyer | Sale Price | Title Company |
|---|---|---|---|
| Yost Paige H | $279,000 | -- | |
| Veeneman Jean | $205,000 | -- | |
| Potts Molly Randy | $158,000 | -- |
Source: Public Records
Mortgage History
| Date | Status | Borrower | Loan Amount |
|---|---|---|---|
| Open | Yost Paige H | $179,000 | |
| Previous Owner | Veeneman Jean | $164,000 | |
| Closed | Potts Molly Randy | $0 |
Source: Public Records
Tax History Compared to Growth
Tax History
| Year | Tax Paid | Tax Assessment Tax Assessment Total Assessment is a certain percentage of the fair market value that is determined by local assessors to be the total taxable value of land and additions on the property. | Land | Improvement |
|---|---|---|---|---|
| 2025 | $3,242 | $230,240 | $53,400 | $176,840 |
| 2023 | $5,923 | $209,840 | $33,960 | $175,880 |
| 2022 | $3,100 | $167,360 | $33,840 | $133,520 |
| 2021 | $3,061 | $136,680 | $26,000 | $110,680 |
| 2020 | $3,082 | $132,080 | $24,600 | $107,480 |
| 2019 | $363 | $136,560 | $27,560 | $109,000 |
| 2018 | $3,404 | $119,760 | $21,640 | $98,120 |
| 2017 | $2,920 | $97,960 | $16,880 | $81,080 |
| 2016 | $2,870 | $97,960 | $16,880 | $81,080 |
| 2015 | $2,901 | $97,960 | $16,880 | $81,080 |
| 2014 | $2,740 | $90,720 | $16,200 | $74,520 |
Source: Public Records
Map
Nearby Homes
- 11420 Crossington Rd
- 5785 Oxborough Way Unit 1
- 11705 Bentham Ct Unit 1
- 230 Sessingham Ln
- 775 Ellsborough Ct
- 11575 Windbrooke Way Unit 2
- 640 Arncliffe Ct Unit 1
- 595 Barsham Way
- 11615 Windbrooke Way
- 11800 Carriage Park Ln
- 130 Wyndlam Ct
- 11260 Donnington Dr
- 5470 N Hillbrooke Trace
- 5690 Abbotts Bridge Rd
- 3010 Lakeside Ct
- 5325 Hillgate Crossing
- 5680 Abbotts Bridge Rd
- 335 Dunhill Way Ct
- 11235 Surrey Park Trail
- 7260 Fawn Lake Dr
- 5825 Haterleigh Dr Unit 1
- 115 Sessingham Ln
- 5855 Haterleigh Dr
- 5815 Haterleigh Dr
- 125 Sessingham Ln
- 5810 Haterleigh Dr Unit 1
- 5800 Haterleigh Dr
- 120 Sessingham Ln
- 5865 Haterleigh Dr
- 5830 Haterleigh Dr
- 5790 Haterleigh Dr Unit 1
- 135 Sessingham Ln Unit 1
- 5805 Haterleigh Dr
- 120 Sessignham Ln
- 0 Haterleigh Dr Unit 7168846
- 0 Haterleigh Dr Unit 8740163
- 0 Haterleigh Dr Unit 7051437
- 0 Haterleigh Dr Unit 3105688
- 0 Haterleigh Dr Unit 3098714
- 130 Sessingham Ln