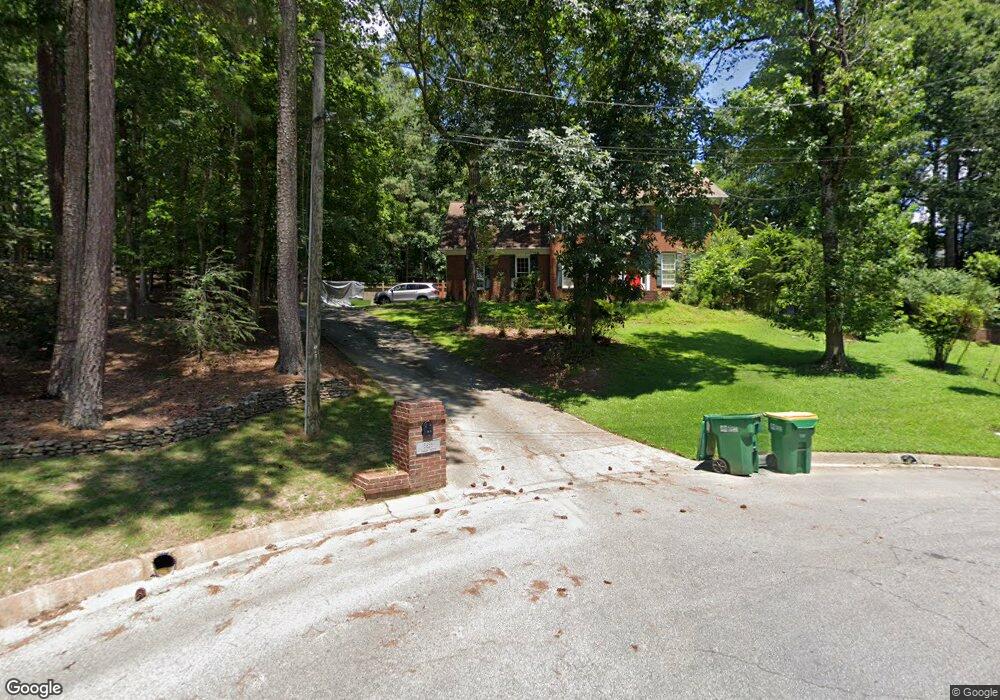
5835 Match Point Unit 4 Norcross, GA 30092
Estimated Value: $591,000 - $723,000
4
Beds
3
Baths
2,476
Sq Ft
$256/Sq Ft
Est. Value
About This Home
This home is located at 5835 Match Point Unit 4, Norcross, GA 30092 and is currently estimated at $633,180, approximately $255 per square foot. 5835 Match Point Unit 4 is a home located in Gwinnett County with nearby schools including Simpson Elementary School, Pinckneyville Middle School, and Norcross High School.
Ownership History
Date
Name
Owned For
Owner Type
Purchase Details
Closed on
Sep 14, 2005
Sold by
Carter John H and Carter Sandra
Bought by
Cook Philip and Cook Darshananda
Current Estimated Value
Home Financials for this Owner
Home Financials are based on the most recent Mortgage that was taken out on this home.
Original Mortgage
$237,600
Outstanding Balance
$124,910
Interest Rate
5.77%
Mortgage Type
New Conventional
Estimated Equity
$508,270
Purchase Details
Closed on
Oct 22, 1999
Sold by
Zimmerman H Mason H and Zimmerman Shelly M
Bought by
Carter John H and Carter Sandra L
Home Financials for this Owner
Home Financials are based on the most recent Mortgage that was taken out on this home.
Original Mortgage
$185,200
Interest Rate
7.76%
Mortgage Type
New Conventional
Create a Home Valuation Report for This Property
The Home Valuation Report is an in-depth analysis detailing your home's value as well as a comparison with similar homes in the area
Home Values in the Area
Average Home Value in this Area
Purchase History
| Date | Buyer | Sale Price | Title Company |
|---|---|---|---|
| Cook Philip | $297,000 | -- | |
| Carter John H | $231,500 | -- |
Source: Public Records
Mortgage History
| Date | Status | Borrower | Loan Amount |
|---|---|---|---|
| Open | Cook Philip | $237,600 | |
| Closed | Cook Philip | $59,400 | |
| Previous Owner | Carter John H | $185,200 |
Source: Public Records
Tax History Compared to Growth
Tax History
| Year | Tax Paid | Tax Assessment Tax Assessment Total Assessment is a certain percentage of the fair market value that is determined by local assessors to be the total taxable value of land and additions on the property. | Land | Improvement |
|---|---|---|---|---|
| 2025 | -- | $205,600 | $38,000 | $167,600 |
| 2024 | $5,400 | $194,480 | $50,400 | $144,080 |
| 2023 | $5,400 | $170,360 | $44,000 | $126,360 |
| 2022 | $4,551 | $153,040 | $36,000 | $117,040 |
| 2021 | $4,101 | $127,320 | $35,520 | $91,800 |
| 2020 | $4,127 | $127,320 | $35,520 | $91,800 |
| 2019 | $3,888 | $121,640 | $30,000 | $91,640 |
| 2018 | $3,900 | $121,640 | $30,000 | $91,640 |
| 2016 | $3,498 | $104,960 | $24,000 | $80,960 |
| 2015 | $3,531 | $104,960 | $24,000 | $80,960 |
| 2014 | -- | $104,960 | $24,000 | $80,960 |
Source: Public Records
Map
Nearby Homes
- 5885 Match Point
- 5961 Ranger Ct
- 4053 Spalding Hollow NW
- 5970 Rachel Ridge Unit 2
- 3962 Gunnin Rd
- 6169 Poplar Bluff Cir
- 6040 Neely Farm Dr Unit 3
- 3922 Glen Meadow Dr
- 5786 Broxton Cir
- 5649 Whitesburg Ct
- 5863 Revington Dr
- 3910 Spalding Bluff Dr
- 4102 Ailey Ct
- 0 Hawk Run Unit 7571401
- 0 Hawk Run
- 4410 River Trail Dr Unit 383
- 4405 River Trail Dr
- 5545 Fitzpatrick Terrace
- 5846 Match Point
- 4186 Nahunta Ct
- 4176 Nahunta Ct Unit 11
- 4196 Nahunta Ct Unit 11
- 5855 Match Point
- 5856 Match Point Unit 4
- 4166 Nahunta Ct
- 5860 Wilbanks Dr
- 5870 Wilbanks Dr Unit 1
- 5866 Match Point
- 5865 Match Point
- 0 Nahunta Ct Unit 7099287
- 4187 Nahunta Ct
- 4321 Flippen Trail
- 5843 Pro Dr
- 5880 Wilbanks Dr
- 5850 Wilbanks Dr
- 4207 Nahunta Ct
- 4197 Nahunta Ct
- 5875 Match Point Unit 5