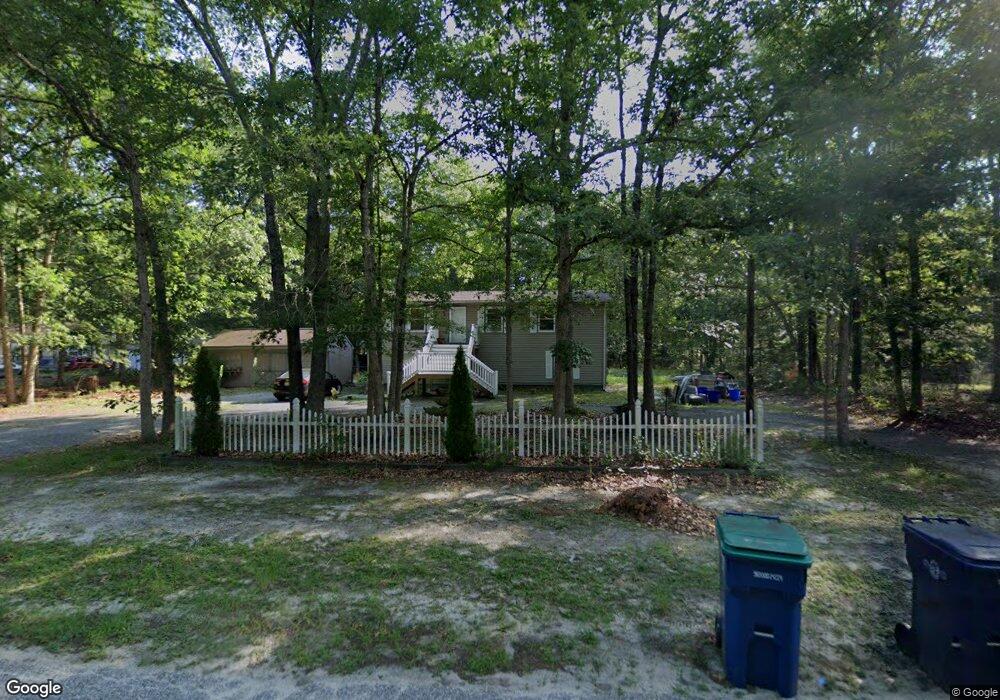
5835 Peach St Mays Landing, NJ 08330
Estimated Value: $399,000 - $483,000
4
Beds
2
Baths
2,112
Sq Ft
$203/Sq Ft
Est. Value
About This Home
This home is located at 5835 Peach St, Mays Landing, NJ 08330 and is currently estimated at $428,992, approximately $203 per square foot. 5835 Peach St is a home located in Atlantic County with nearby schools including Joseph Shaner School, George L. Hess Educational Complex, and William Davies Middle School.
Ownership History
Date
Name
Owned For
Owner Type
Purchase Details
Closed on
Dec 19, 2018
Sold by
Nardy Michael
Bought by
Nardy Michael and Jamison Linda D
Current Estimated Value
Purchase Details
Closed on
Mar 17, 2008
Sold by
Palmer Joseph F and Palmer Laura A
Bought by
Nardy Michael and Nardy Gino
Home Financials for this Owner
Home Financials are based on the most recent Mortgage that was taken out on this home.
Original Mortgage
$273,704
Outstanding Balance
$170,696
Interest Rate
5.76%
Mortgage Type
FHA
Estimated Equity
$258,296
Create a Home Valuation Report for This Property
The Home Valuation Report is an in-depth analysis detailing your home's value as well as a comparison with similar homes in the area
Home Values in the Area
Average Home Value in this Area
Purchase History
| Date | Buyer | Sale Price | Title Company |
|---|---|---|---|
| Nardy Michael | -- | None Available | |
| Nardy Michael | $278,000 | Foundation Title |
Source: Public Records
Mortgage History
| Date | Status | Borrower | Loan Amount |
|---|---|---|---|
| Open | Nardy Michael | $273,704 |
Source: Public Records
Tax History Compared to Growth
Tax History
| Year | Tax Paid | Tax Assessment Tax Assessment Total Assessment is a certain percentage of the fair market value that is determined by local assessors to be the total taxable value of land and additions on the property. | Land | Improvement |
|---|---|---|---|---|
| 2025 | $6,252 | $189,500 | $39,600 | $149,900 |
| 2024 | $6,252 | $189,500 | $39,600 | $149,900 |
| 2023 | $5,863 | $189,500 | $39,600 | $149,900 |
| 2022 | $5,863 | $189,500 | $39,600 | $149,900 |
| 2021 | $5,850 | $189,500 | $39,600 | $149,900 |
| 2020 | $5,850 | $189,500 | $39,600 | $149,900 |
| 2019 | $5,865 | $189,500 | $39,600 | $149,900 |
| 2018 | $5,651 | $189,500 | $39,600 | $149,900 |
| 2017 | $5,558 | $189,500 | $39,600 | $149,900 |
| 2016 | $5,395 | $189,500 | $39,600 | $149,900 |
| 2015 | $5,204 | $189,500 | $39,600 | $149,900 |
| 2014 | $5,101 | $203,700 | $44,600 | $159,100 |
Source: Public Records
Map
Nearby Homes