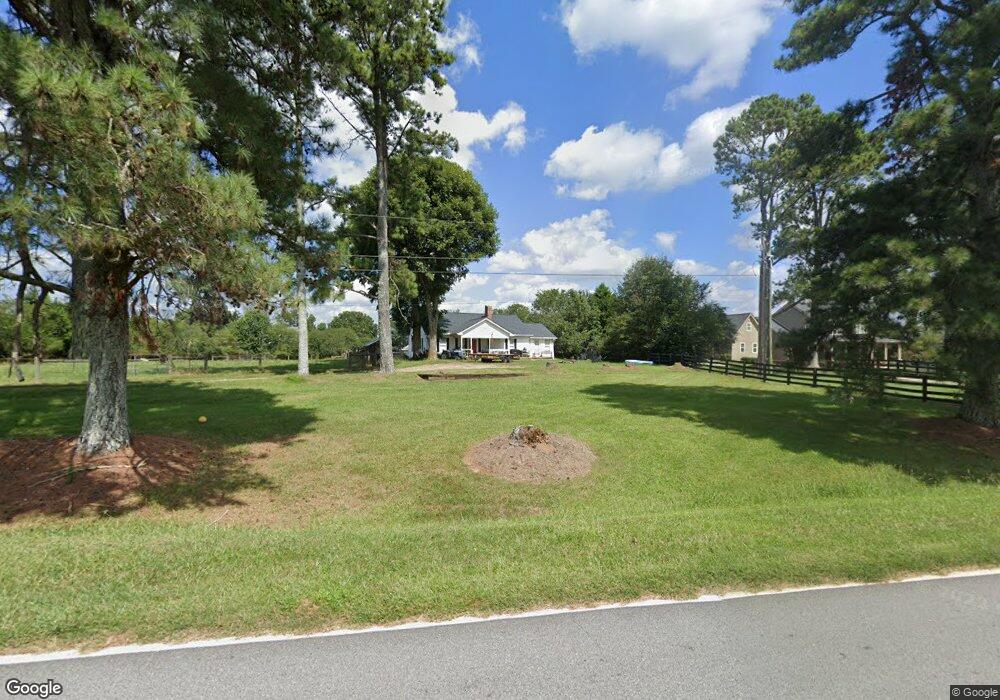
5837 Bowen Bridge Rd Clermont, GA 30527
Estimated Value: $273,000 - $309,651
3
Beds
2
Baths
1,408
Sq Ft
$207/Sq Ft
Est. Value
About This Home
This home is located at 5837 Bowen Bridge Rd, Clermont, GA 30527 and is currently estimated at $291,413, approximately $206 per square foot. 5837 Bowen Bridge Rd is a home located in Hall County with nearby schools including Wauka Mountain Elementary School, North Hall Middle School, and North Hall High School.
Ownership History
Date
Name
Owned For
Owner Type
Purchase Details
Closed on
Jun 6, 2011
Sold by
Federal Home Loan Mortgage Corporation
Bought by
Mcnally Raquel
Current Estimated Value
Purchase Details
Closed on
Dec 7, 2010
Sold by
Us Bk National Assn
Bought by
Federal Home Loan Mortgage Corporation
Purchase Details
Closed on
Nov 3, 2009
Sold by
Savage Donald R and Savage Carrie B
Bought by
Stephens Fedl Bk
Purchase Details
Closed on
Sep 21, 1998
Sold by
Still Ahna Fulcher
Bought by
H & M Land Company
Purchase Details
Closed on
Jan 5, 1998
Sold by
Head Rogers
Bought by
Merritt Wm David
Purchase Details
Closed on
May 6, 1997
Sold by
Head Rogers
Bought by
Laneve Dominick A and Laneve Lisa R
Purchase Details
Closed on
Oct 1, 1996
Create a Home Valuation Report for This Property
The Home Valuation Report is an in-depth analysis detailing your home's value as well as a comparison with similar homes in the area
Home Values in the Area
Average Home Value in this Area
Purchase History
| Date | Buyer | Sale Price | Title Company |
|---|---|---|---|
| Mcnally Raquel | -- | -- | |
| Federal Home Loan Mortgage Corporation | -- | -- | |
| Us Bk National Assn | $120,000 | -- | |
| Stephens Fedl Bk | $483,434 | -- | |
| H & M Land Company | $83,300 | -- | |
| Merritt Wm David | $589,000 | -- | |
| Laneve Dominick A | $108,800 | -- | |
| -- | $78,200 | -- |
Source: Public Records
Mortgage History
| Date | Status | Borrower | Loan Amount |
|---|---|---|---|
| Closed | Laneve Dominick A | -- |
Source: Public Records
Tax History Compared to Growth
Tax History
| Year | Tax Paid | Tax Assessment Tax Assessment Total Assessment is a certain percentage of the fair market value that is determined by local assessors to be the total taxable value of land and additions on the property. | Land | Improvement |
|---|---|---|---|---|
| 2024 | $2,558 | $101,924 | $18,280 | $83,644 |
| 2023 | $2,534 | $100,964 | $18,280 | $82,684 |
| 2022 | $2,315 | $88,524 | $18,280 | $70,244 |
| 2021 | $1,333 | $50,045 | $9,520 | $40,525 |
| 2020 | $1,318 | $48,085 | $9,520 | $38,565 |
| 2019 | $1,151 | $41,605 | $9,520 | $32,085 |
| 2018 | $900 | $31,482 | $9,520 | $21,962 |
| 2017 | $922 | $31,482 | $9,520 | $21,962 |
| 2016 | $957 | $33,462 | $9,520 | $23,942 |
| 2015 | $964 | $33,462 | $9,520 | $23,942 |
| 2014 | $964 | $33,462 | $9,520 | $23,942 |
Source: Public Records
Map
Nearby Homes
- 5814 Gailey Dr
- 6310 Green Mountain Ln
- 6223 Hulsey Rd
- 6421 Holly Springs Rd
- 239 Brown Dr
- 5519 Cleveland Hwy
- 0 Holly Springs Rd Unit 7661867
- 0 Holly Springs Rd Unit 25494296
- 0 Holly Springs Rd Unit 10623983
- 6708 Clermont Hwy
- 6552 Shoal Creek Rd
- 455 Long Mountain Ct
- 5375 Clarks Bridge Rd
- 6632 Mountain Meadow Dr
- 7896 Calvary Cross Rd
- 6580 Cleveland Hwy
- 6655 Windvane Point
- 6622 Old Cleveland Rd
- 5837 Bowen Bridge Rd
- 5855 Bowen Bridge Rd
- 5855 Bowen Bridge Rd
- 5809 Bowen Bridge Rd
- 5821 Bowen Bridge Rd
- 5822 Bowen Bridge Rd
- 5810 Clarks Bridge Rd
- 5830 Clarks Bridge Rd
- 5801 Clarks Bridge Rd
- 5829 Clarks Bridge Rd
- 5743 Clarks Bridge Rd
- 5751 Clarks Bridge Rd
- 5982 Gailey Dr
- 5976 Gailey Dr
- 5889 Bowen Bridge Rd
- 5954 Gailey Dr
- 5900 Clarks Bridge Rd
- 5942 Gailey Dr
- 5955 Gailey Dr
- 5963 Gailey Dr