Estimated Value: $373,000 - $419,000
4
Beds
1
Bath
1,097
Sq Ft
$355/Sq Ft
Est. Value
About This Home
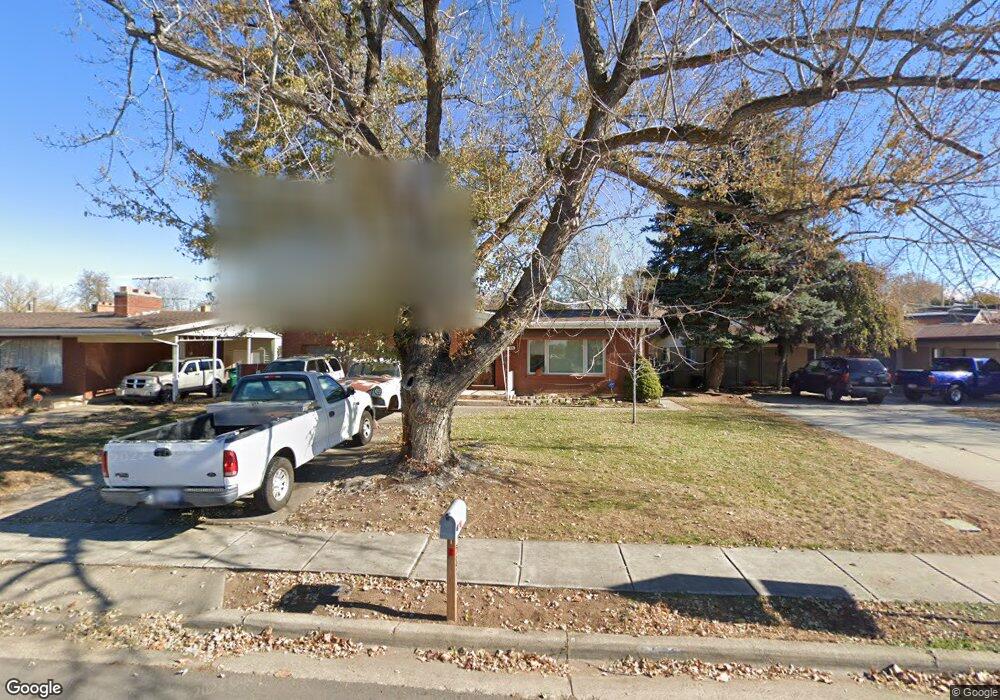
This home is located at 5838 S 2200 W, Roy, UT 84067 and is currently estimated at $389,920, approximately $355 per square foot. 5838 S 2200 W is a home located in Weber County with nearby schools including Municipal School, Roy Junior High School, and Roy High School.
Ownership History
Date
Name
Owned For
Owner Type
Purchase Details
Closed on
May 2, 1997
Sold by
Holmes Paul E and Hall Kelly L
Bought by
Holmes Paul E
Current Estimated Value
Home Financials for this Owner
Home Financials are based on the most recent Mortgage that was taken out on this home.
Original Mortgage
$98,569
Outstanding Balance
$13,454
Interest Rate
7.96%
Mortgage Type
FHA
Estimated Equity
$376,466
Purchase Details
Closed on
Nov 27, 1996
Sold by
Rodzinak Lola M
Bought by
Rodzinak Edward J
Create a Home Valuation Report for This Property
The Home Valuation Report is an in-depth analysis detailing your home's value as well as a comparison with similar homes in the area
Home Values in the Area
Average Home Value in this Area
Purchase History
| Date | Buyer | Sale Price | Title Company |
|---|---|---|---|
| Holmes Paul E | -- | U S Title | |
| Holmes Paul E | -- | U S Title | |
| Rodzinak Edward J | -- | -- |
Source: Public Records
Mortgage History
| Date | Status | Borrower | Loan Amount |
|---|---|---|---|
| Open | Holmes Paul E | $98,569 |
Source: Public Records
Tax History Compared to Growth
Tax History
| Year | Tax Paid | Tax Assessment Tax Assessment Total Assessment is a certain percentage of the fair market value that is determined by local assessors to be the total taxable value of land and additions on the property. | Land | Improvement |
|---|---|---|---|---|
| 2025 | $2,504 | $394,963 | $117,179 | $277,784 |
| 2024 | $2,459 | $215,049 | $64,456 | $150,593 |
| 2023 | $2,374 | $207,900 | $60,014 | $147,886 |
| 2022 | $2,462 | $222,750 | $52,884 | $169,866 |
| 2021 | $1,919 | $283,000 | $66,638 | $216,362 |
| 2020 | $1,742 | $235,000 | $66,638 | $168,362 |
| 2019 | $1,757 | $224,000 | $37,226 | $186,774 |
| 2018 | $1,670 | $200,000 | $35,245 | $164,755 |
| 2017 | $1,478 | $164,000 | $32,536 | $131,464 |
| 2016 | $1,430 | $85,306 | $16,063 | $69,243 |
| 2015 | $1,281 | $77,540 | $16,063 | $61,477 |
| 2014 | $1,292 | $77,540 | $16,063 | $61,477 |
Source: Public Records
Map
Nearby Homes
- 5643 S 2200 W
- 2146 W 5600 S Unit 29
- 428 W 2650 N
- 480 W 2650 N
- 484 W 2650 N
- 5545 S 2100 W Unit 12
- 5545 S 2100 W Unit 20
- 5545 S 2100 W Unit D22
- 5810 S 2550 W
- 2632 2125 W
- 5902 S 1900 W
- 2635 N 500 W Unit 45
- 350 W 2575 N
- 2602 N 2125 W
- 2622 2125 W
- 2622 N 175 W
- 244 W 2575 N
- 2612 N 525 W
- 2588 N 2125 W
- 389 W 2575 N