Estimated Value: $489,138 - $557,000
4
Beds
2
Baths
2,142
Sq Ft
$239/Sq Ft
Est. Value
About This Home
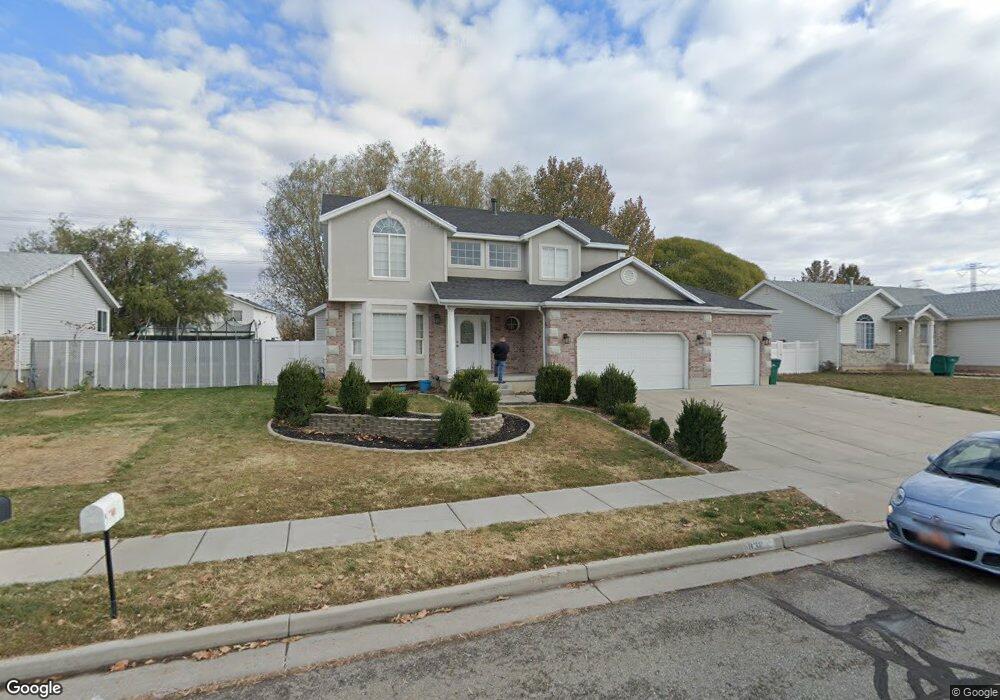
This home is located at 5838 S 3325 W, Roy, UT 84067 and is currently estimated at $512,535, approximately $239 per square foot. 5838 S 3325 W is a home located in Weber County with nearby schools including Roy Elementary School, Roy Junior High School, and Roy High School.
Ownership History
Date
Name
Owned For
Owner Type
Purchase Details
Closed on
Feb 22, 2022
Sold by
Allen Whittle Shaun
Bought by
Whittle Shaun and Whittle Taycee R
Current Estimated Value
Home Financials for this Owner
Home Financials are based on the most recent Mortgage that was taken out on this home.
Original Mortgage
$368,843
Outstanding Balance
$339,874
Interest Rate
3.55%
Mortgage Type
FHA
Estimated Equity
$172,661
Purchase Details
Closed on
Dec 10, 2019
Sold by
Valentine Barbara
Bought by
Whittle Shaun Allen and Whittle Donna S
Home Financials for this Owner
Home Financials are based on the most recent Mortgage that was taken out on this home.
Original Mortgage
$262,500
Interest Rate
3.7%
Mortgage Type
New Conventional
Purchase Details
Closed on
Jul 11, 2019
Sold by
Valentine Steve B
Bought by
Valentine Barbara
Purchase Details
Closed on
Mar 27, 1998
Sold by
Nilson & Company Inc
Bought by
Valentine Steve B and Valentine Barbara
Create a Home Valuation Report for This Property
The Home Valuation Report is an in-depth analysis detailing your home's value as well as a comparison with similar homes in the area
Home Values in the Area
Average Home Value in this Area
Purchase History
We collect this data history from publicly available records. To have your information removed, we recommend requesting removal directly through your county’s website.
| Date | Buyer | Sale Price | Title Company |
|---|---|---|---|
| Whittle Shaun | -- | None Listed On Document | |
| Whittle Shaun Allen | -- | Us Title Insurance Agency | |
| Valentine Barbara | -- | None Available | |
| Valentine Steve B | -- | Bonneville Title Company |
Source: Public Records
Mortgage History
We collect this data history from publicly available records. To have your information removed, we recommend requesting removal directly through your county’s website.
| Date | Status | Borrower | Loan Amount |
|---|---|---|---|
| Open | Whittle Shaun | $368,843 | |
| Previous Owner | Whittle Shaun Allen | $262,500 |
Source: Public Records
Tax History
| Year | Tax Paid | Tax Assessment Tax Assessment Total Assessment is a certain percentage of the fair market value that is determined by local assessors to be the total taxable value of land and additions on the property. | Land | Improvement |
|---|---|---|---|---|
| 2025 | $3,107 | $501,277 | $126,464 | $374,813 |
| 2024 | $3,028 | $270,599 | $69,480 | $201,119 |
| 2023 | $3,155 | $284,350 | $69,481 | $214,869 |
| 2022 | $3,190 | $295,350 | $58,927 | $236,423 |
| 2021 | $2,530 | $384,000 | $82,869 | $301,131 |
| 2020 | $2,390 | $333,000 | $82,869 | $250,131 |
| 2019 | $2,372 | $312,000 | $48,245 | $263,755 |
| 2018 | $2,203 | $272,000 | $45,304 | $226,696 |
| 2017 | $2,028 | $234,000 | $44,461 | $189,539 |
| 2016 | $2,008 | $125,012 | $23,854 | $101,158 |
| 2015 | $1,680 | $105,806 | $21,195 | $84,611 |
| 2014 | $1,522 | $93,673 | $21,195 | $72,478 |
Source: Public Records
Map
Nearby Homes
Your Personal Tour Guide
Ask me questions while you tour the home.