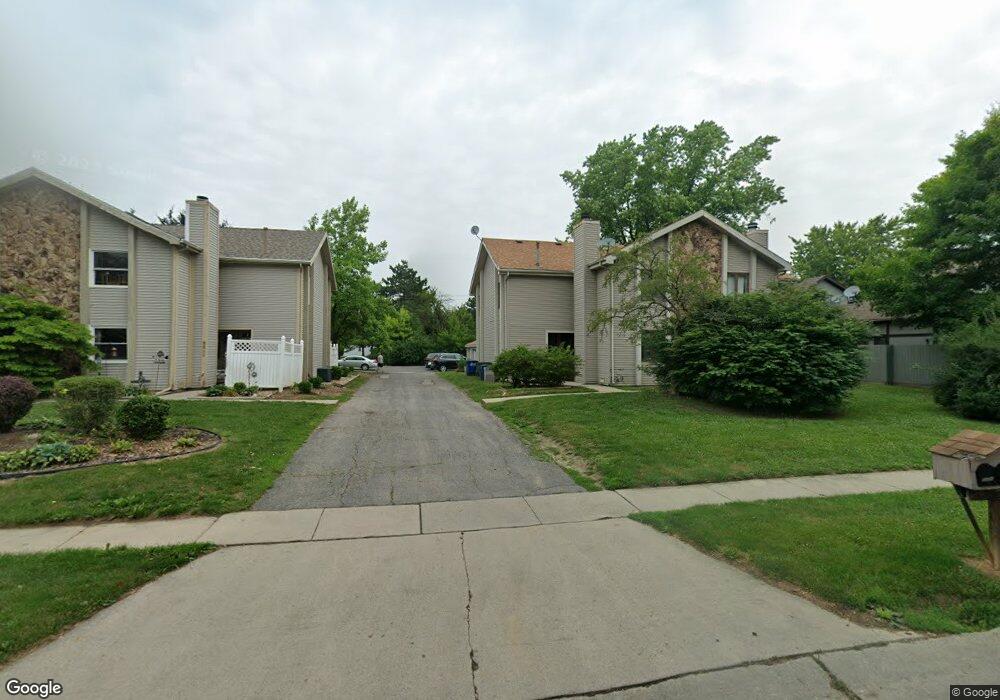
5838 Staghorn Dr Unit B Toledo, OH 43614
Southwyck NeighborhoodEstimated Value: $128,000 - $148,000
2
Beds
2
Baths
1,480
Sq Ft
$94/Sq Ft
Est. Value
About This Home
This home is located at 5838 Staghorn Dr Unit B, Toledo, OH 43614 and is currently estimated at $139,345, approximately $94 per square foot. 5838 Staghorn Dr Unit B is a home located in Lucas County with nearby schools including Fairfield Elementary School, Maumee Intermediate School, and Maumee Middle School.
Ownership History
Date
Name
Owned For
Owner Type
Purchase Details
Closed on
Nov 24, 2004
Sold by
Heckman Bryan L
Bought by
Knopp Mark C
Current Estimated Value
Home Financials for this Owner
Home Financials are based on the most recent Mortgage that was taken out on this home.
Original Mortgage
$78,400
Outstanding Balance
$37,342
Interest Rate
5%
Mortgage Type
New Conventional
Estimated Equity
$102,004
Purchase Details
Closed on
Jan 26, 1998
Sold by
Heter Jaye E and Heter Michelle R
Bought by
Heckman Bryan L
Home Financials for this Owner
Home Financials are based on the most recent Mortgage that was taken out on this home.
Original Mortgage
$69,300
Interest Rate
7.16%
Purchase Details
Closed on
May 16, 1994
Sold by
Roselli Jean M
Purchase Details
Closed on
Jul 13, 1988
Sold by
Hofmann Karen K
Create a Home Valuation Report for This Property
The Home Valuation Report is an in-depth analysis detailing your home's value as well as a comparison with similar homes in the area
Home Values in the Area
Average Home Value in this Area
Purchase History
| Date | Buyer | Sale Price | Title Company |
|---|---|---|---|
| Knopp Mark C | $98,000 | -- | |
| Heckman Bryan L | $77,000 | Louisville Title Agency For | |
| -- | $74,400 | -- | |
| -- | $67,500 | -- |
Source: Public Records
Mortgage History
| Date | Status | Borrower | Loan Amount |
|---|---|---|---|
| Open | Knopp Mark C | $78,400 | |
| Previous Owner | Heckman Bryan L | $69,300 |
Source: Public Records
Tax History Compared to Growth
Tax History
| Year | Tax Paid | Tax Assessment Tax Assessment Total Assessment is a certain percentage of the fair market value that is determined by local assessors to be the total taxable value of land and additions on the property. | Land | Improvement |
|---|---|---|---|---|
| 2024 | $1,243 | $40,215 | $4,410 | $35,805 |
| 2023 | $1,936 | $26,705 | $3,395 | $23,310 |
| 2022 | $1,860 | $26,705 | $3,395 | $23,310 |
| 2021 | $1,957 | $26,705 | $3,395 | $23,310 |
| 2020 | $2,082 | $25,095 | $2,520 | $22,575 |
| 2019 | $2,032 | $25,095 | $2,520 | $22,575 |
| 2018 | $1,998 | $25,095 | $2,520 | $22,575 |
| 2017 | $1,995 | $24,500 | $2,450 | $22,050 |
| 2016 | $1,982 | $70,000 | $7,000 | $63,000 |
| 2015 | $1,974 | $70,000 | $7,000 | $63,000 |
| 2014 | $2,263 | $30,630 | $3,610 | $27,020 |
| 2013 | $2,263 | $30,630 | $3,610 | $27,020 |
Source: Public Records
Map
Nearby Homes
- 5770 Staghorn Dr Unit 5770
- 5741 Heatherbank Rd
- 2437 Knights Hill Ln
- 2258 Tanglewood Dr
- 5366 Glenridge Dr
- 2124 Tanglewood Dr
- 6325 Millbrook Rd
- 6524 Glenhurst Dr
- 6627 Embassy Ct Unit I38
- 2001 Perrysburg Holland Rd Unit 118
- 6652 Sue Ln
- 2158 Laurel Valley Dr
- 6053 Suffolk Ln Unit 6053
- 6705 Garden Rd Unit 6705
- 6696 Embassy Ct Unit C11
- 1705 Henthorne Dr
- 1668 Brownstone Blvd Unit 633
- 6716 Embassy Ct Unit 8
- 2020 W Crest Dr
- 1562 Saddlebrook Ct Unit B
- 5836 Staghorn Dr Unit A
- 5834 Staghorn Dr Unit 5834
- 5850 Staghorn Dr
- 5850 Staghorn Dr Unit A
- 5842 Staghorn Dr
- 5830 Staghorn Dr
- 5832 Staghorn Dr Unit 5832
- 5840 Staghorn Dr Unit C
- 5828 Staghorn Dr Unit 5828
- 5844 Staghorn Dr Unit D
- 5846 Staghorn Dr Unit C
- 5826 Staghorn Dr
- 5824 Staghorn Dr
- 5822 Staghorn Dr
- 5820 Staghorn Dr
- 5906 Staghorn Dr Unit 5906
- 5847 Staghorn Dr Unit 5847
- 5839 Staghorn Dr Unit 5839
- 5908 Staghorn Dr Unit 5908
- 5833 Staghorn Dr Unit 5833