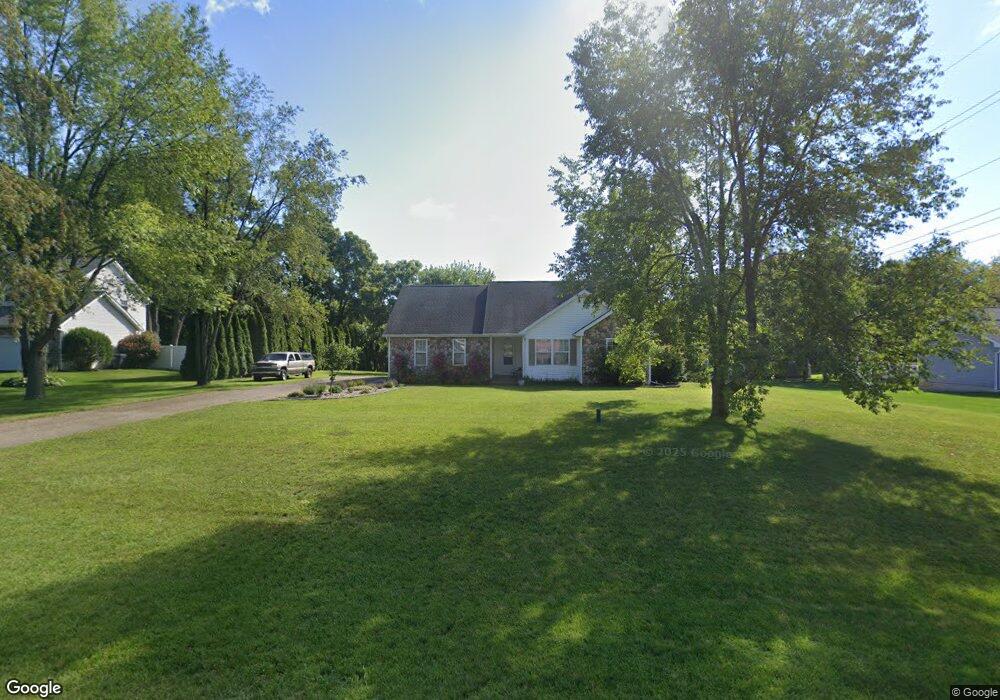
58381 Kristina Cir E Paw Paw, MI 49079
Estimated Value: $297,000 - $340,000
--
Bed
--
Bath
1,120
Sq Ft
$281/Sq Ft
Est. Value
About This Home
This home is located at 58381 Kristina Cir E, Paw Paw, MI 49079 and is currently estimated at $314,537, approximately $280 per square foot. 58381 Kristina Cir E is a home located in Van Buren County with nearby schools including Mattawan Early Elementary School, Mattawan Later Elementary School, and Mattawan Early Childhood Education Center.
Ownership History
Date
Name
Owned For
Owner Type
Purchase Details
Closed on
Aug 23, 2016
Sold by
Notghi Kathy
Bought by
Hayward Christopher and Hayward Kimberly
Current Estimated Value
Home Financials for this Owner
Home Financials are based on the most recent Mortgage that was taken out on this home.
Original Mortgage
$158,460
Outstanding Balance
$72,495
Interest Rate
3.48%
Mortgage Type
New Conventional
Estimated Equity
$242,042
Purchase Details
Closed on
Jul 20, 2016
Sold by
Notghi Ken
Bought by
Notghi Kathy
Home Financials for this Owner
Home Financials are based on the most recent Mortgage that was taken out on this home.
Original Mortgage
$158,460
Outstanding Balance
$72,495
Interest Rate
3.48%
Mortgage Type
New Conventional
Estimated Equity
$242,042
Purchase Details
Closed on
Nov 26, 2002
Bought by
Notghi Ken Khosrow
Purchase Details
Closed on
Dec 27, 2001
Bought by
Val-U-Built Const Ltd
Create a Home Valuation Report for This Property
The Home Valuation Report is an in-depth analysis detailing your home's value as well as a comparison with similar homes in the area
Home Values in the Area
Average Home Value in this Area
Purchase History
| Date | Buyer | Sale Price | Title Company |
|---|---|---|---|
| Hayward Christopher | $166,800 | Chicago Title Of Michigan | |
| Notghi Kathy | -- | Chicago Title Of Michigan | |
| Notghi Kathy | -- | Attorney | |
| Notghi Ken Khosrow | -- | -- | |
| Val-U-Built Const Ltd | -- | -- |
Source: Public Records
Mortgage History
| Date | Status | Borrower | Loan Amount |
|---|---|---|---|
| Open | Notghi Kathy | $158,460 |
Source: Public Records
Tax History Compared to Growth
Tax History
| Year | Tax Paid | Tax Assessment Tax Assessment Total Assessment is a certain percentage of the fair market value that is determined by local assessors to be the total taxable value of land and additions on the property. | Land | Improvement |
|---|---|---|---|---|
| 2025 | $979 | $147,600 | $0 | $0 |
| 2024 | $979 | $127,600 | $0 | $0 |
| 2023 | $932 | $113,100 | $0 | $0 |
| 2022 | $2,969 | $101,300 | $0 | $0 |
| 2021 | $2,856 | $95,400 | $17,000 | $78,400 |
| 2020 | $2,817 | $86,100 | $17,000 | $69,100 |
| 2019 | $2,613 | $85,700 | $85,700 | $0 |
| 2018 | $2,554 | $77,100 | $77,100 | $0 |
| 2017 | $2,515 | $77,100 | $0 | $0 |
| 2016 | $2,183 | $67,400 | $0 | $0 |
| 2015 | $1,936 | $67,400 | $0 | $0 |
| 2014 | $1,913 | $64,700 | $0 | $0 |
| 2013 | -- | $63,500 | $63,500 | $0 |
Source: Public Records
Map
Nearby Homes
- 28313 58th Ave
- 28302 Springbrook Dr
- 59134 Whitewood Dr
- 55800 30th St
- 61121 Airpark Ln
- 59103 Silvergrass Dr
- 58664 Swenson St
- 58640 Swenson St
- 58367 Swenson St
- 58913 Swenson St
- 59037 Norton St
- 59075 Norton St
- 29055 E Red Arrow Hwy
- 52117 County Road 657
- Elements 1870 Plan at Concord Farms
- Traditions 1600 V8.0b Plan at Concord Farms - Traditions
- Elements 2100 Plan at Concord Farms
- Integrity 2060 Plan at Concord Farms - Integrity
- Elements 2390 Plan at Concord Farms
- Integrity 1460 Plan at Concord Farms - Integrity
- 58293 Kristina Cir E
- 58477 Kristina Cir E
- 58225 Kristina Cir E
- 58559 Kristina Cir E
- 58376 Kristina Cir E
- 58300 Kristina Cir E
- 58470 Kristina Cir E
- 58635 Kristina Cir E
- 58222 Kristina Cir
- 58222 Kristina Cir E
- 58554 Kristina Cir E
- 28161 58th Ave
- 28125 58th Ave
- 58358 County Road 657
- 58505 County Road 657
- 58584 County Road 657
- 58282 County Road 657
- 58210 County Road 657
- 58640 County Road 657
- 58436 County Road 657