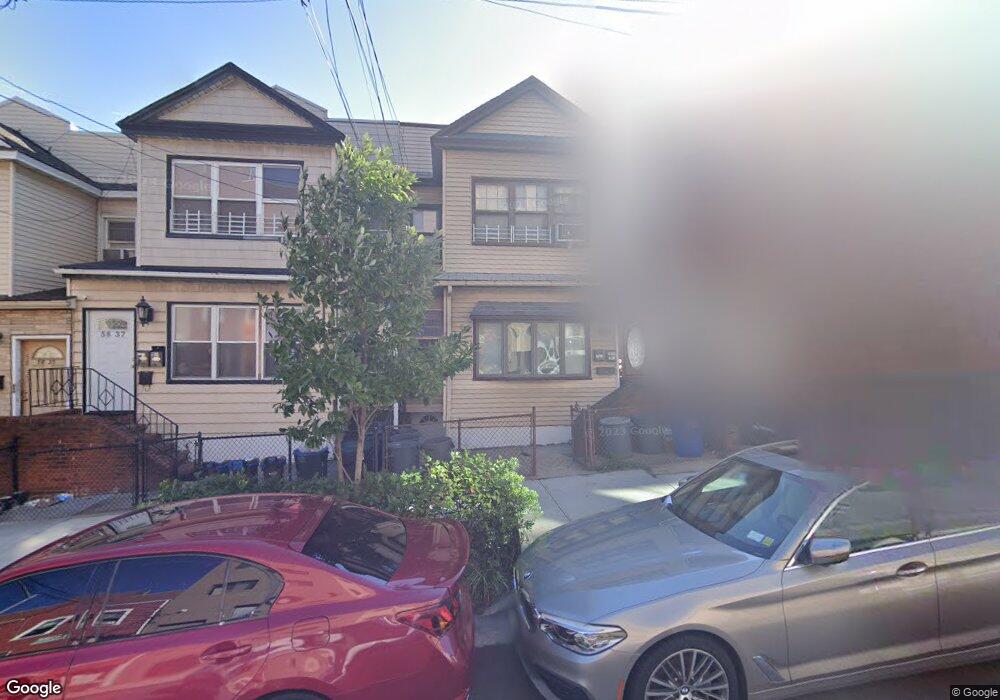
5839 59th St Maspeth, NY 11378
Maspeth NeighborhoodEstimated Value: $868,024 - $1,004,000
Studio
--
Bath
2,072
Sq Ft
$457/Sq Ft
Est. Value
About This Home
This home is located at 5839 59th St, Maspeth, NY 11378 and is currently estimated at $947,256, approximately $457 per square foot. 5839 59th St is a home located in Queens County with nearby schools including P.S. 153 Maspeth, IS 73 - The Frank Sansivieri School, and Grover Cleveland High School.
Ownership History
Date
Name
Owned For
Owner Type
Purchase Details
Closed on
Oct 21, 2021
Sold by
Marcaida Damian
Bought by
Sf Dream Llc
Current Estimated Value
Home Financials for this Owner
Home Financials are based on the most recent Mortgage that was taken out on this home.
Original Mortgage
$585,000
Interest Rate
2.98%
Mortgage Type
Purchase Money Mortgage
Purchase Details
Closed on
Oct 3, 2001
Sold by
Nichols Edward N
Bought by
Buccheri Louise P and Nichols Louise P
Home Financials for this Owner
Home Financials are based on the most recent Mortgage that was taken out on this home.
Original Mortgage
$210,000
Interest Rate
6.89%
Purchase Details
Closed on
Sep 17, 2001
Sold by
Buccheri Louise P
Bought by
Marcaida Damian
Home Financials for this Owner
Home Financials are based on the most recent Mortgage that was taken out on this home.
Original Mortgage
$210,000
Interest Rate
6.89%
Create a Home Valuation Report for This Property
The Home Valuation Report is an in-depth analysis detailing your home's value as well as a comparison with similar homes in the area
Home Values in the Area
Average Home Value in this Area
Purchase History
| Date | Buyer | Sale Price | Title Company |
|---|---|---|---|
| Sf Dream Llc | $780,000 | -- | |
| Buccheri Louise P | -- | -- | |
| Marcaida Damian | -- | -- |
Source: Public Records
Mortgage History
| Date | Status | Borrower | Loan Amount |
|---|---|---|---|
| Previous Owner | Sf Dream Llc | $585,000 | |
| Previous Owner | Marcaida Damian | $210,000 |
Source: Public Records
Tax History
| Year | Tax Paid | Tax Assessment Tax Assessment Total Assessment is a certain percentage of the fair market value that is determined by local assessors to be the total taxable value of land and additions on the property. | Land | Improvement |
|---|---|---|---|---|
| 2025 | $7,513 | $38,695 | $8,365 | $30,330 |
| 2024 | $7,513 | $37,404 | $8,752 | $28,652 |
| 2023 | $7,168 | $35,686 | $7,595 | $28,091 |
| 2022 | $6,775 | $53,940 | $13,140 | $40,800 |
| 2021 | $6,786 | $49,620 | $13,140 | $36,480 |
| 2020 | $6,826 | $54,540 | $13,140 | $41,400 |
| 2019 | $6,520 | $46,680 | $13,140 | $33,540 |
| 2018 | $6,062 | $29,738 | $7,913 | $21,825 |
| 2017 | $5,770 | $28,305 | $10,331 | $17,974 |
| 2016 | $5,372 | $28,305 | $10,331 | $17,974 |
| 2015 | $3,001 | $26,872 | $11,723 | $15,149 |
| 2014 | $3,001 | $25,975 | $11,171 | $14,804 |
Source: Public Records
Map
Nearby Homes
- 5912 58th Rd
- 5801 59th St
- 59-17 58th Ave
- 5940 Flushing Ave
- 58-22 60th Place
- 6060 Flushing Ave
- 57-37 59th St
- 58-29 60th Ln
- 5907 59th Dr
- 5814 58th Ave
- 60-15 Maspeth Ave
- 5949 56th Dr
- 61-38 Grand Ave
- 56-57 61st St
- 5807 Maspeth Ave
- 60-14 60th Ave
- 57-22 63rd St
- 61-22 56th Dr
- 5974 Fresh Pond Rd
- 6014 56th Ave
Your Personal Tour Guide
Ask me questions while you tour the home.