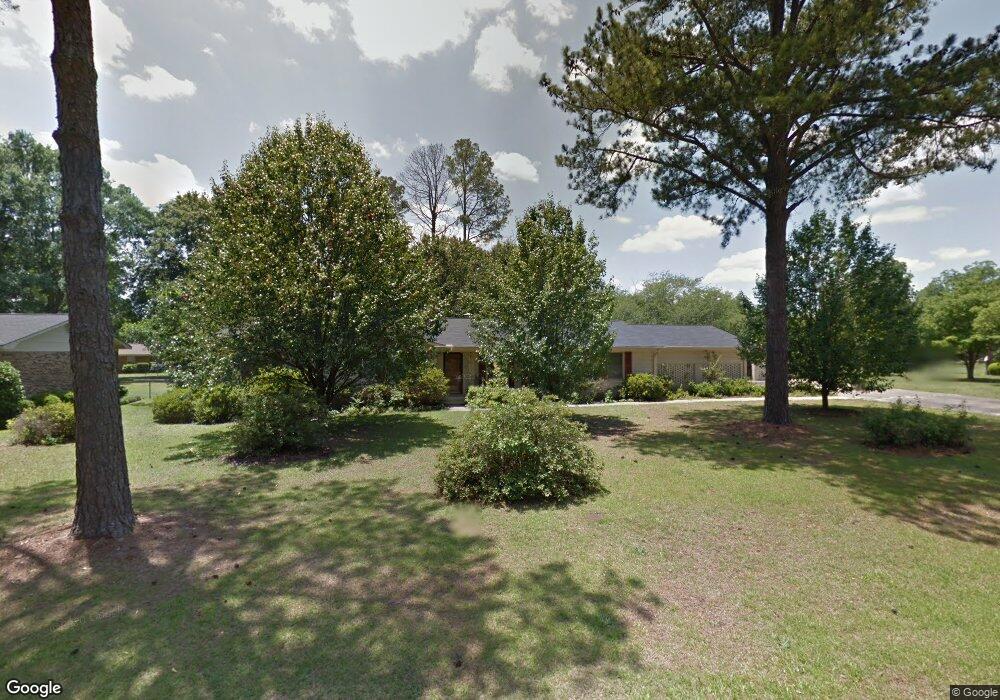
5839 J Dr Macon, GA 31216
Estimated Value: $217,279 - $266,000
3
Beds
2
Baths
2,261
Sq Ft
$107/Sq Ft
Est. Value
About This Home
This home is located at 5839 J Dr, Macon, GA 31216 and is currently estimated at $242,820, approximately $107 per square foot. 5839 J Dr is a home located in Bibb County with nearby schools including Porter Elementary School, Rutland Middle School, and Rutland High School.
Ownership History
Date
Name
Owned For
Owner Type
Purchase Details
Closed on
Apr 21, 2025
Sold by
Childress Ronald L
Bought by
Childress Mark Anthony
Current Estimated Value
Purchase Details
Closed on
Mar 22, 2021
Sold by
Busbee Keith James and Busbee James Keith
Bought by
Childress Ronald Lee
Purchase Details
Closed on
Dec 8, 1995
Sold by
Hattaway Reuben W and Hattaway Carolyn S
Bought by
Busbee Clement J
Create a Home Valuation Report for This Property
The Home Valuation Report is an in-depth analysis detailing your home's value as well as a comparison with similar homes in the area
Home Values in the Area
Average Home Value in this Area
Purchase History
| Date | Buyer | Sale Price | Title Company |
|---|---|---|---|
| Childress Mark Anthony | -- | None Listed On Document | |
| Childress Ronald Lee | $81,500 | None Available | |
| Busbee Clement J | $118,000 | -- |
Source: Public Records
Tax History Compared to Growth
Tax History
| Year | Tax Paid | Tax Assessment Tax Assessment Total Assessment is a certain percentage of the fair market value that is determined by local assessors to be the total taxable value of land and additions on the property. | Land | Improvement |
|---|---|---|---|---|
| 2025 | $2,140 | $87,065 | $13,800 | $73,265 |
| 2024 | $2,039 | $80,295 | $13,800 | $66,495 |
| 2023 | $1,713 | $67,461 | $12,000 | $55,461 |
| 2022 | $2,174 | $62,805 | $10,590 | $52,215 |
| 2021 | $1,998 | $52,569 | $8,664 | $43,905 |
| 2020 | $2,041 | $52,569 | $8,664 | $43,905 |
| 2019 | $2,058 | $52,569 | $8,664 | $43,905 |
| 2018 | $3,115 | $48,956 | $8,183 | $40,773 |
| 2017 | $1,834 | $48,956 | $8,183 | $40,773 |
| 2016 | $1,194 | $48,956 | $8,183 | $40,773 |
| 2015 | $1,694 | $48,956 | $8,183 | $40,773 |
| 2014 | $1,694 | $48,956 | $8,183 | $40,773 |
Source: Public Records
Map
Nearby Homes