
$460,000
- 3 Beds
- 2 Baths
- 3,101 Sq Ft
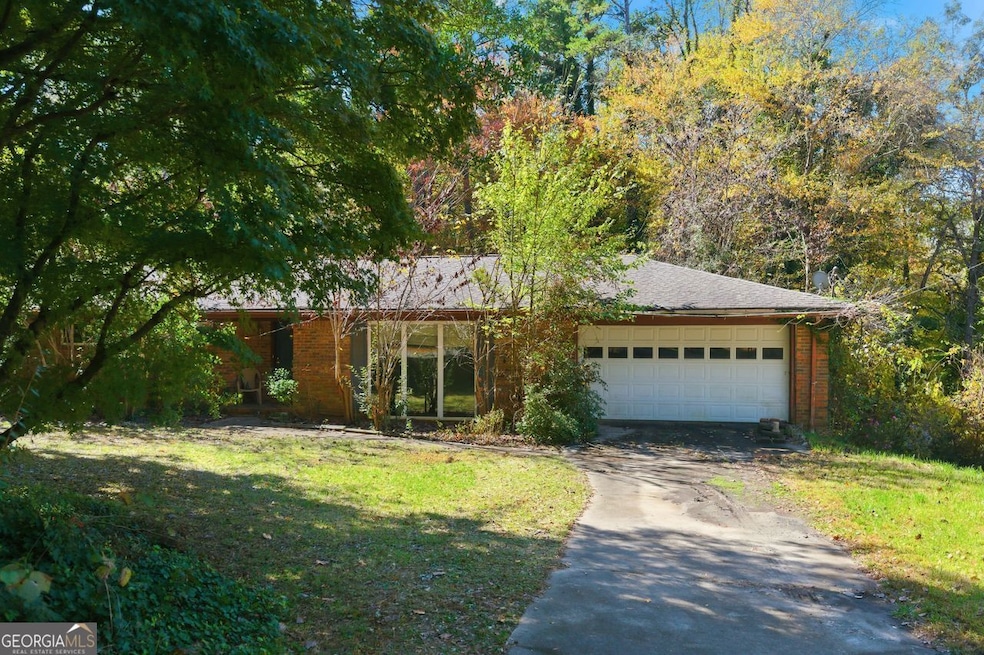
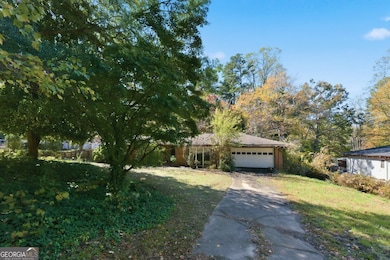
- 2011 Shadowwood Dr
- Marietta, GA
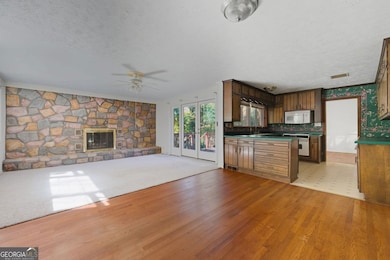
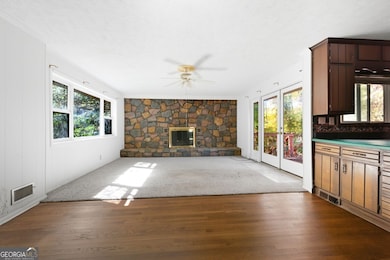
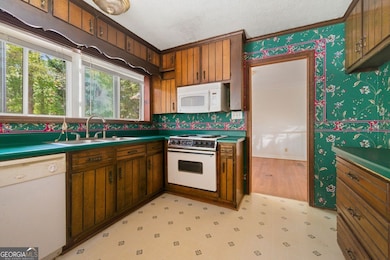
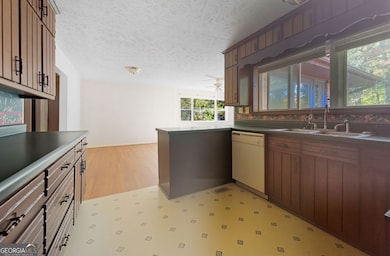
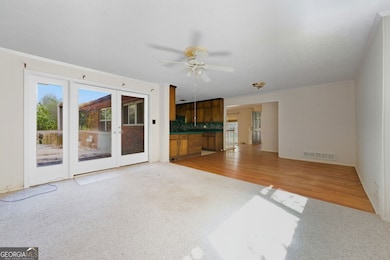
Welcome to 2011 Shadowood Drive, a beautifully updated ranch tucked away on a peaceful half-acre lot in Marietta's highly desired Shadowood community. Step inside to find a bright, open layout filled with natural light from brand-new energy-efficient windows. The cozy new fireplace adds warmth and character, while the finished basement offers versatile space perfect for a home office, media room,
Laura Lerman eXp Realty