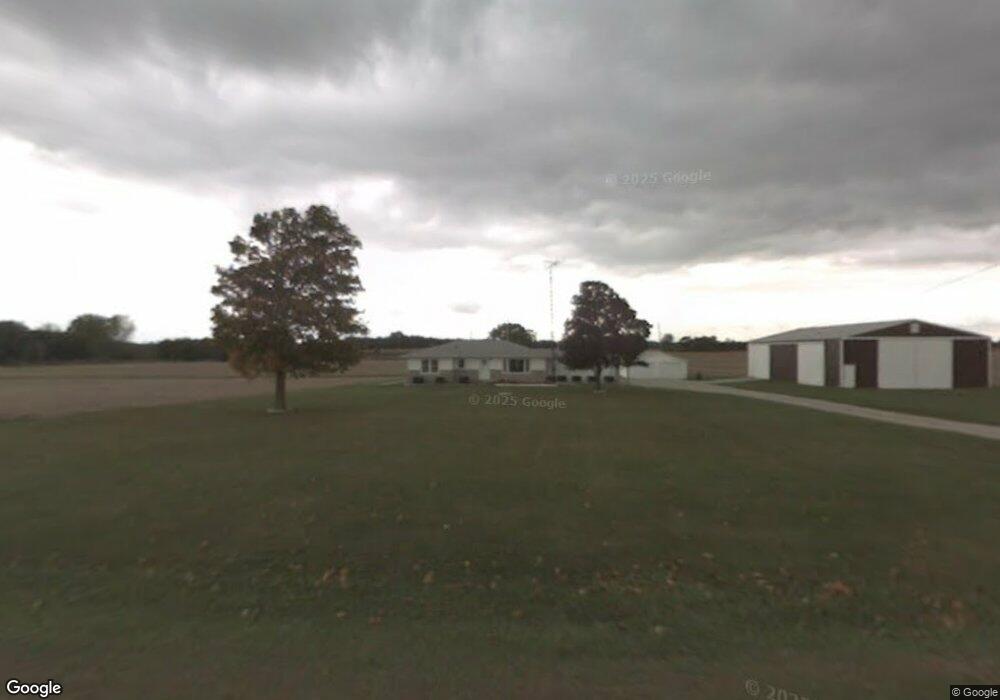
5839 N Anderson Dr Delphi, IN 46923
Estimated Value: $256,000
3
Beds
1
Bath
2,872
Sq Ft
$89/Sq Ft
Est. Value
About This Home
This home is located at 5839 N Anderson Dr, Delphi, IN 46923 and is currently estimated at $256,000, approximately $89 per square foot. 5839 N Anderson Dr is a home located in Carroll County with nearby schools including Delphi Community Elementary School, Delphi Community Middle School, and Delphi Community High School.
Ownership History
Date
Name
Owned For
Owner Type
Purchase Details
Closed on
Feb 14, 2022
Sold by
Horn Denis E and Horn Bonnie L
Bought by
Wildcat Resources Llc
Current Estimated Value
Home Financials for this Owner
Home Financials are based on the most recent Mortgage that was taken out on this home.
Original Mortgage
$380,000
Interest Rate
2.93%
Mortgage Type
New Conventional
Purchase Details
Closed on
Feb 27, 2020
Sold by
Horn Denis E
Bought by
Horn Denis E and Horn Bonnie
Purchase Details
Closed on
Feb 2, 2018
Sold by
Horn Deanne
Bought by
L & A Park Foundation Inc
Purchase Details
Closed on
Feb 1, 2018
Sold by
Horn Denas E
Bought by
L And A Park Foundation Inc
Purchase Details
Closed on
May 13, 2014
Sold by
Horn Deanne
Bought by
Horn Deanne and Deanne Horn Revocable Trust
Purchase Details
Closed on
Jan 31, 2012
Sold by
Horn Denis E and Horn Deanne
Bought by
State Of Indiana
Create a Home Valuation Report for This Property
The Home Valuation Report is an in-depth analysis detailing your home's value as well as a comparison with similar homes in the area
Home Values in the Area
Average Home Value in this Area
Purchase History
| Date | Buyer | Sale Price | Title Company |
|---|---|---|---|
| Wildcat Resources Llc | -- | None Listed On Document | |
| Wildcat Resources Llc | -- | None Listed On Document | |
| Tree Line Holdings Llc | -- | None Listed On Document | |
| Tree Line Holdings Llc | -- | None Listed On Document | |
| Kerkhoff Wright Llc | -- | Spigle John E | |
| Horn Denis E | -- | None Available | |
| L & A Park Foundation Inc | -- | None Available | |
| L And A Park Foundation Inc | -- | None Available | |
| Horn Deanne | -- | None Available | |
| State Of Indiana | $455,700 | None Available |
Source: Public Records
Mortgage History
| Date | Status | Borrower | Loan Amount |
|---|---|---|---|
| Previous Owner | Kerkhoff Wright Llc | $380,000 |
Source: Public Records
Tax History Compared to Growth
Tax History
| Year | Tax Paid | Tax Assessment Tax Assessment Total Assessment is a certain percentage of the fair market value that is determined by local assessors to be the total taxable value of land and additions on the property. | Land | Improvement |
|---|---|---|---|---|
| 2024 | $19 | $1,500 | $1,500 | $0 |
| 2023 | $1,619 | $1,200 | $1,200 | $0 |
| 2022 | $1,619 | $130,800 | $130,800 | $0 |
| 2021 | $1,492 | $112,500 | $112,500 | $0 |
| 2020 | $1,591 | $111,600 | $111,600 | $0 |
| 2019 | $2,005 | $136,000 | $136,000 | $0 |
| 2018 | $1,947 | $140,600 | $140,600 | $0 |
| 2017 | $2,941 | $295,800 | $189,300 | $106,500 |
| 2016 | $3,119 | $297,300 | $199,000 | $98,300 |
| 2014 | $3,266 | $296,000 | $204,800 | $91,200 |
Source: Public Records
Map
Nearby Homes
- 112 Williston Ct
- 409 N Wilson St
- 116 Williston Ct
- 205 E Franklin St
- 317 N Market St
- 215 W Front St
- 228 W Vine St
- 230 W Vine St
- 232 W Vine St
- 1158 N Brewer Ave
- 5122 W 700 N
- 4139 N 900 W
- 9331 W 310 N
- 2801 N 930 W Unit 10
- 6365 Erie St
- 6374 N 260 W
- 2075 N 925 W
- 6518 N 285 W
- 35 Pond View Dr
- 8649 W Division Line Rd
- 5839 N Anderson Dr
- 5766 N Anderson Dr
- 5645 W State Road 218
- 6055 N Anderson Dr
- 5627 W State Road 218
- 5605 W State Road 218
- 5579 W State Road 218
- 5557 W State Road 218
- 5513 W State Road 218
- 5387 W State Road 218
- TBD St Rd 218 Unit 2
- 000 Indiana 218
- 4585 N State Road 25
- 5365 W State Road 218
- 3571 N 575 W
- 3476 N 575 W
- 3525 N 575 W
- 49 Pond View Dr
- 4152 N 525 W
- 3939 N 525 W