Estimated Value: $336,000 - $382,009
2
Beds
1
Bath
912
Sq Ft
$389/Sq Ft
Est. Value
About This Home
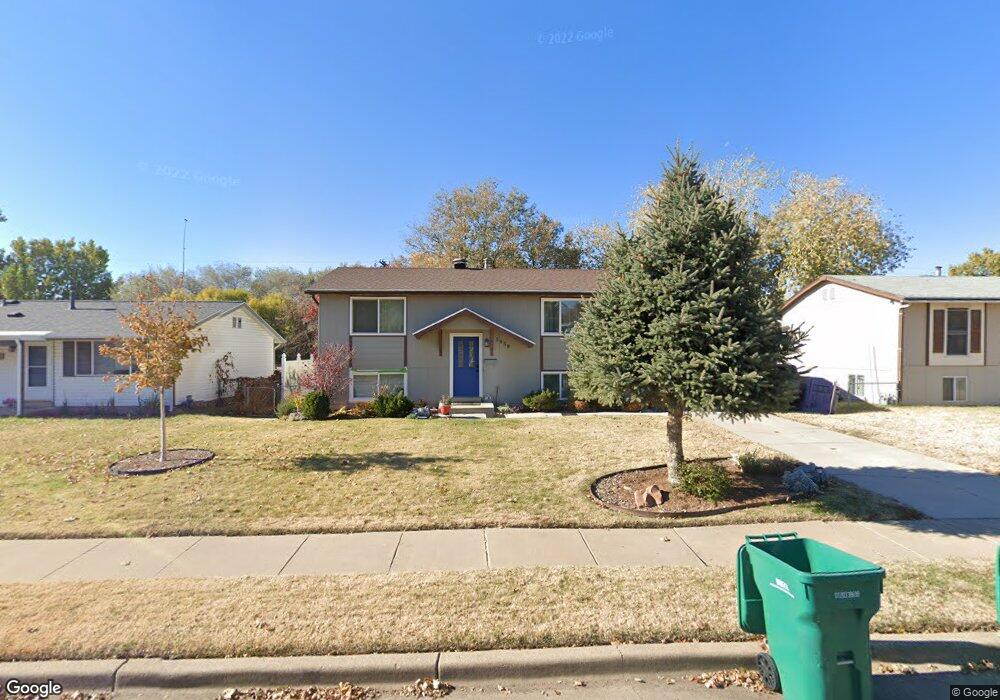
This home is located at 5839 S 2450 W, Roy, UT 84067 and is currently estimated at $355,002, approximately $389 per square foot. 5839 S 2450 W is a home located in Weber County with nearby schools including Municipal School, Roy Junior High School, and Roy High School.
Ownership History
Date
Name
Owned For
Owner Type
Purchase Details
Closed on
Jul 15, 1998
Sold by
Eldredge Lorna E and Mcnay Lorna E
Bought by
Mcnay Lorna E
Current Estimated Value
Home Financials for this Owner
Home Financials are based on the most recent Mortgage that was taken out on this home.
Original Mortgage
$16,000
Outstanding Balance
$3,274
Interest Rate
7%
Estimated Equity
$351,728
Purchase Details
Closed on
Aug 19, 1997
Sold by
Mcnay Lorna E
Bought by
Eldredge Lorna E
Home Financials for this Owner
Home Financials are based on the most recent Mortgage that was taken out on this home.
Original Mortgage
$77,625
Interest Rate
7.45%
Create a Home Valuation Report for This Property
The Home Valuation Report is an in-depth analysis detailing your home's value as well as a comparison with similar homes in the area
Home Values in the Area
Average Home Value in this Area
Purchase History
| Date | Buyer | Sale Price | Title Company |
|---|---|---|---|
| Mcnay Lorna E | -- | Inwest Title | |
| Eldredge Lorna E | -- | Backman Stewart Title |
Source: Public Records
Mortgage History
| Date | Status | Borrower | Loan Amount |
|---|---|---|---|
| Open | Mcnay Lorna E | $16,000 | |
| Previous Owner | Eldredge Lorna E | $77,625 |
Source: Public Records
Tax History
| Year | Tax Paid | Tax Assessment Tax Assessment Total Assessment is a certain percentage of the fair market value that is determined by local assessors to be the total taxable value of land and additions on the property. | Land | Improvement |
|---|---|---|---|---|
| 2025 | $2,177 | $337,210 | $112,070 | $225,140 |
| 2024 | $2,139 | $183,699 | $61,645 | $122,054 |
| 2023 | $2,138 | $184,800 | $57,059 | $127,741 |
| 2022 | $2,115 | $188,100 | $50,026 | $138,074 |
| 2021 | $1,653 | $239,000 | $63,306 | $175,694 |
| 2020 | $1,564 | $208,000 | $63,306 | $144,694 |
| 2019 | $1,519 | $190,000 | $35,721 | $154,279 |
| 2018 | $1,389 | $162,000 | $33,866 | $128,134 |
| 2017 | $1,243 | $134,000 | $32,592 | $101,408 |
| 2016 | $1,259 | $73,534 | $16,035 | $57,499 |
| 2015 | $1,087 | $63,795 | $16,035 | $47,760 |
| 2014 | $1,050 | $60,603 | $16,035 | $44,568 |
Source: Public Records
Map
Nearby Homes
- 2419 W 5850 S
- 5810 S 2550 W
- 2564 W 5950 S
- 2571 W 5725 S
- 2349 Chateau Dr
- 5923 S 2625 W
- 2190 W 5700 S
- 5643 S 2200 W
- 484 W 2650 N
- 2627 W 5625 S
- 2646 W 5625 S Unit M-2646
- 2144 W 5700 S
- 2676 W 6050 S
- 2612 N 525 W
- 2593 N 500 W Unit 56
- 2146 W 5600 S Unit 29
- 2182 W 5600 S Unit 16
- 5547 S 2150 W
- 2512 N 475 W
- 2829 W 5925 S