Estimated Value: $359,000 - $392,000
4
Beds
2
Baths
881
Sq Ft
$423/Sq Ft
Est. Value
About This Home
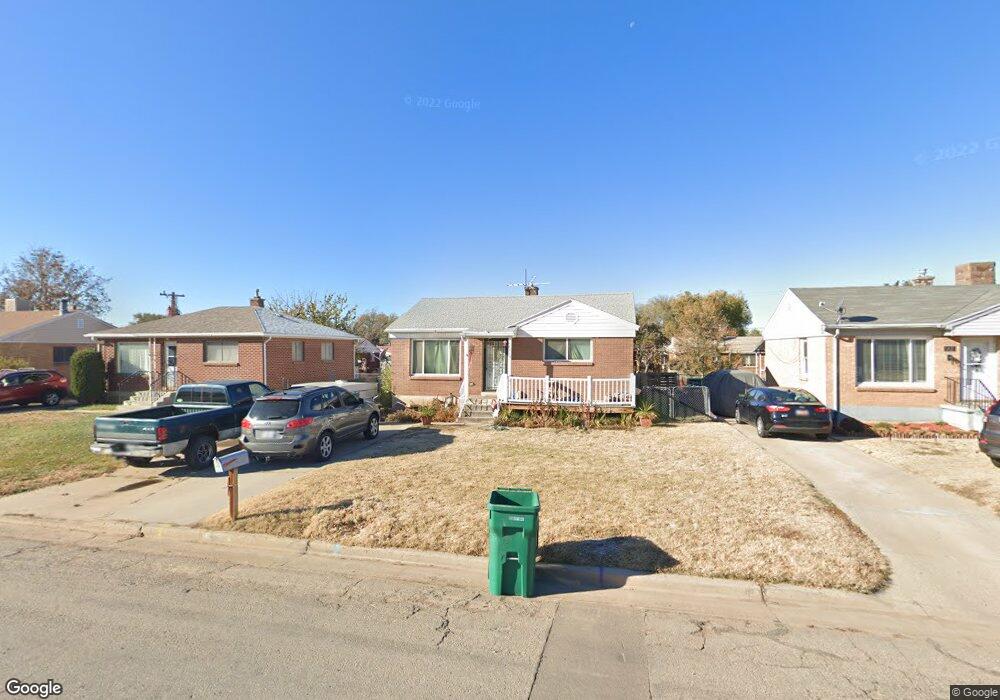
This home is located at 5839 S 2600 W, Roy, UT 84067 and is currently estimated at $372,445, approximately $422 per square foot. 5839 S 2600 W is a home located in Weber County with nearby schools including Roy Elementary School, Roy Junior High School, and Roy High School.
Ownership History
Date
Name
Owned For
Owner Type
Purchase Details
Closed on
Aug 17, 2022
Sold by
Thorpe James Michael and Thorpe Kristin Kim
Bought by
Thorpe James M and Thorpe Kathrin K
Current Estimated Value
Purchase Details
Closed on
Feb 15, 2019
Sold by
Thorpe James M and Thorpe Corey L
Bought by
Thorpe James Michael and Thorpe Kristin Kim
Purchase Details
Closed on
May 1, 2003
Sold by
Thorpe James T and Thorpe Patricia Ann
Bought by
Thorpe James T and Thorpe Patricia A
Create a Home Valuation Report for This Property
The Home Valuation Report is an in-depth analysis detailing your home's value as well as a comparison with similar homes in the area
Home Values in the Area
Average Home Value in this Area
Purchase History
| Date | Buyer | Sale Price | Title Company |
|---|---|---|---|
| Thorpe James M | -- | Intermountain Title | |
| Thorpe James Michael | -- | Intermountain Title Ins & E | |
| Thorpe James T | -- | -- |
Source: Public Records
Tax History Compared to Growth
Tax History
| Year | Tax Paid | Tax Assessment Tax Assessment Total Assessment is a certain percentage of the fair market value that is determined by local assessors to be the total taxable value of land and additions on the property. | Land | Improvement |
|---|---|---|---|---|
| 2025 | $1,973 | $347,983 | $95,215 | $252,768 |
| 2024 | $1,902 | $185,899 | $52,376 | $133,523 |
| 2023 | $1,792 | $175,450 | $53,638 | $121,812 |
| 2022 | $2,046 | $204,050 | $49,858 | $154,192 |
| 2021 | $1,663 | $275,000 | $58,268 | $216,732 |
| 2020 | $1,400 | $212,000 | $58,268 | $153,732 |
| 2019 | $1,301 | $186,000 | $34,683 | $151,317 |
| 2018 | $1,110 | $150,000 | $30,008 | $119,992 |
| 2017 | $1,029 | $131,000 | $30,008 | $100,992 |
| 2016 | $997 | $68,428 | $17,228 | $51,200 |
| 2015 | $882 | $62,437 | $19,813 | $42,624 |
| 2014 | $853 | $59,674 | $14,630 | $45,044 |
Source: Public Records
Map
Nearby Homes
- 2587 W 5750 S
- 2571 W 5725 S
- 2672 W 5750 S
- 5810 S 2550 W
- 2646 W 5625 S Unit M-2646
- 2829 W 5925 S
- 2907 W 5775 S
- 5568 S 2800 W Unit 5B
- 2778 W 5550 S Unit 28
- 2786 W 5550 S Unit C11
- 484 W 2650 N
- 2995 W 5750 S
- 480 W 2650 N
- 3027 W 2600 N
- 3033 W 2600 N
- 3068 W 2600 N
- 2635 N 500 W Unit 45
- 2612 N 525 W
- 5643 S 2200 W
- 2593 N 500 W Unit 56