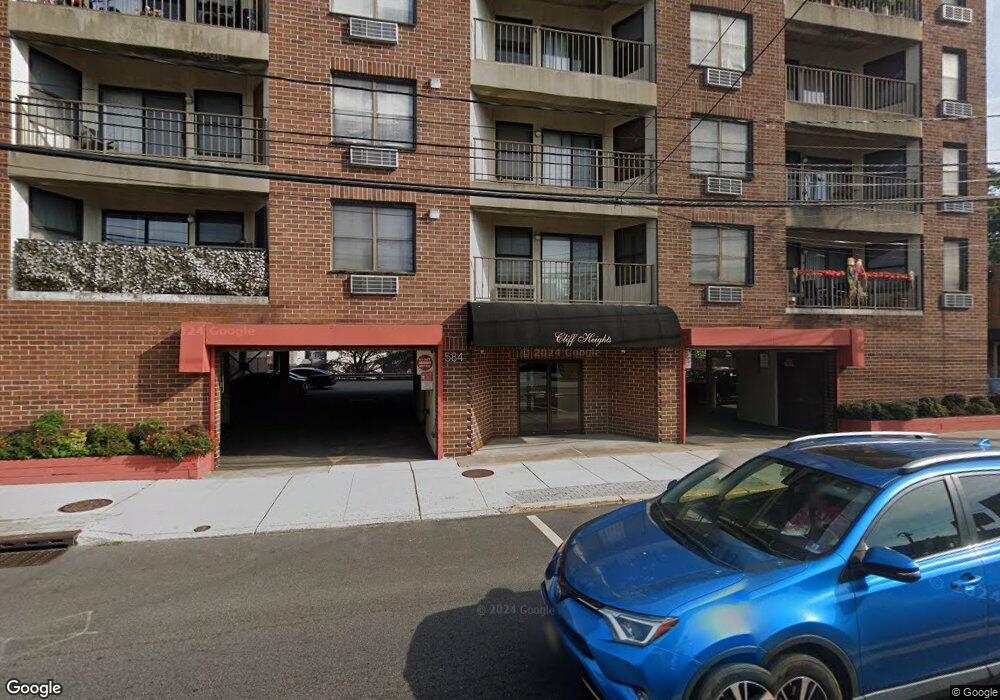
584 Anderson Ave Unit C005F Cliffside Park, NJ 07010
Estimated Value: $378,930 - $467,000
--
Bed
--
Bath
850
Sq Ft
$483/Sq Ft
Est. Value
About This Home
This home is located at 584 Anderson Ave Unit C005F, Cliffside Park, NJ 07010 and is currently estimated at $410,483, approximately $482 per square foot. 584 Anderson Ave Unit C005F is a home located in Bergen County with nearby schools including Cliffside Park High School.
Ownership History
Date
Name
Owned For
Owner Type
Purchase Details
Closed on
Jun 11, 2025
Sold by
Han Yeonhee
Bought by
Tang Yong
Current Estimated Value
Home Financials for this Owner
Home Financials are based on the most recent Mortgage that was taken out on this home.
Original Mortgage
$303,750
Outstanding Balance
$302,975
Interest Rate
6.84%
Mortgage Type
New Conventional
Estimated Equity
$107,508
Purchase Details
Closed on
Feb 24, 2017
Sold by
Choi Alexander Won and Choi Alex
Bought by
Han Yeonhee
Home Financials for this Owner
Home Financials are based on the most recent Mortgage that was taken out on this home.
Original Mortgage
$247,000
Interest Rate
4.19%
Mortgage Type
New Conventional
Purchase Details
Closed on
Jul 18, 2005
Purchase Details
Closed on
Aug 3, 2001
Sold by
Kyong Charles
Bought by
Turner Mary E
Create a Home Valuation Report for This Property
The Home Valuation Report is an in-depth analysis detailing your home's value as well as a comparison with similar homes in the area
Home Values in the Area
Average Home Value in this Area
Purchase History
| Date | Buyer | Sale Price | Title Company |
|---|---|---|---|
| Tang Yong | $405,000 | Evergreen Land Title Services | |
| Tang Yong | $405,000 | Evergreen Land Title Services | |
| Han Yeonhee | $260,000 | None Available | |
| -- | $303,000 | -- | |
| Turner Mary E | $158,000 | -- |
Source: Public Records
Mortgage History
| Date | Status | Borrower | Loan Amount |
|---|---|---|---|
| Open | Tang Yong | $303,750 | |
| Closed | Tang Yong | $303,750 | |
| Previous Owner | Han Yeonhee | $247,000 |
Source: Public Records
Tax History Compared to Growth
Tax History
| Year | Tax Paid | Tax Assessment Tax Assessment Total Assessment is a certain percentage of the fair market value that is determined by local assessors to be the total taxable value of land and additions on the property. | Land | Improvement |
|---|---|---|---|---|
| 2025 | $5,688 | $206,400 | $140,000 | $66,400 |
| 2024 | $5,523 | $206,400 | $140,000 | $66,400 |
| 2023 | $5,294 | $206,400 | $140,000 | $66,400 |
| 2022 | $5,294 | $206,400 | $140,000 | $66,400 |
| 2021 | $5,195 | $206,400 | $140,000 | $66,400 |
| 2020 | $5,135 | $206,400 | $140,000 | $66,400 |
| 2019 | $5,040 | $206,400 | $140,000 | $66,400 |
| 2018 | $5,032 | $206,400 | $140,000 | $66,400 |
| 2017 | $4,904 | $205,000 | $140,000 | $65,000 |
| 2016 | $4,807 | $205,000 | $140,000 | $65,000 |
| 2015 | $4,664 | $205,000 | $140,000 | $65,000 |
| 2014 | $4,535 | $205,000 | $140,000 | $65,000 |
Source: Public Records
Map
Nearby Homes
- 555 Gorge Rd Unit 6F
- 555 Gorge Rd Unit 2E
- 580 Oregon Ave
- 393 Lincoln Ave
- 562 Oregon Ave
- 200 Division St Unit 3F
- 201 Oakdene Place Unit C00E2
- 201 Oakdene Place Unit D1
- 647 Anderson Ave
- 451 Wilfred Terrace
- 515 Saint Pauls Ave
- 93 Crescent Ave
- 180 Edgewater Rd Unit 1G
- 180 Edgewater Rd Unit 1A
- 465 Oakdene Ave
- 230 Grant Ave
- 230 Grant Ave Unit Townhouse
- 533 Highridge Ave
- 457 Washington Ave
- 475 Oakdene Ave Unit 2
- 584 Anderson Ave Unit C002E
- 584 Anderson Ave Unit C004B
- 584 Anderson Ave Unit C005E
- 584 Anderson Ave Unit C005D
- 584 Anderson Ave Unit C005B
- 584 Anderson Ave Unit C005A
- 584 Anderson Ave Unit C004F
- 584 Anderson Ave Unit C004E
- 584 Anderson Ave Unit C004D
- 584 Anderson Ave Unit C004C
- 584 Anderson Ave Unit C004A
- 584 Anderson Ave Unit C003F
- 584 Anderson Ave Unit C003E
- 584 Anderson Ave Unit C003D
- 584 Anderson Ave Unit C003C
- 584 Anderson Ave Unit C003B
- 584 Anderson Ave Unit C003A
- 584 Anderson Ave Unit C002G
- 584 Anderson Ave Unit C002F
- 584 Anderson Ave Unit C002D