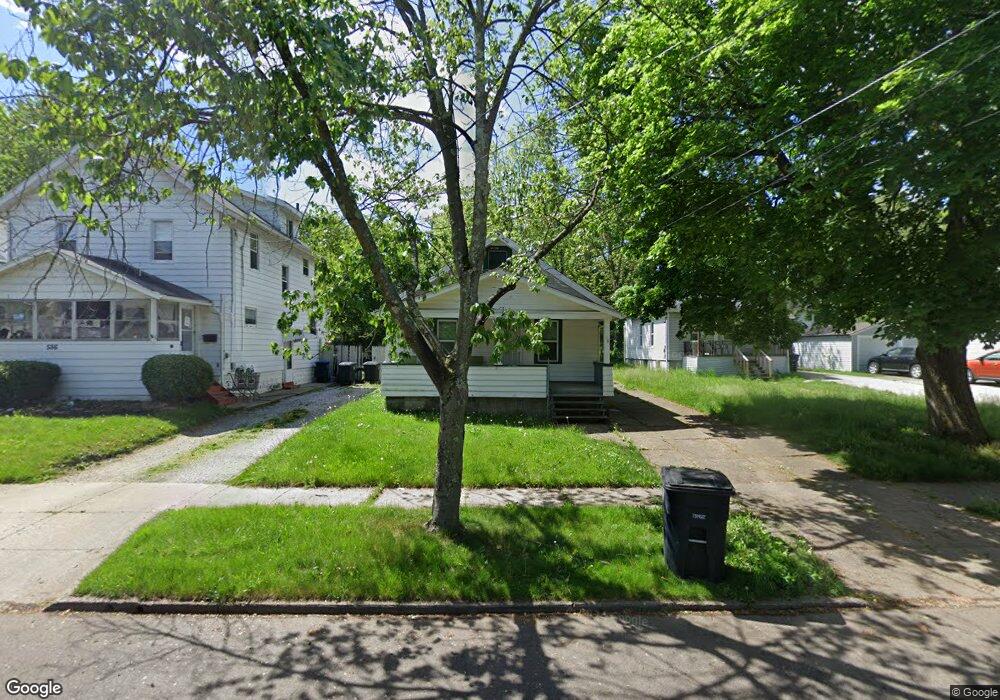
584 Morgan Ave Akron, OH 44311
South Akron NeighborhoodEstimated Value: $57,000 - $70,000
2
Beds
1
Bath
616
Sq Ft
$101/Sq Ft
Est. Value
About This Home
This home is located at 584 Morgan Ave, Akron, OH 44311 and is currently estimated at $62,506, approximately $101 per square foot. 584 Morgan Ave is a home located in Summit County with nearby schools including Glover Community Learning Center, Kenmore Garfield Community Learning Center, and Main Preparatory Academy.
Ownership History
Date
Name
Owned For
Owner Type
Purchase Details
Closed on
Aug 17, 2016
Sold by
Simons Land Properties Llc
Bought by
Mata Management Llc
Current Estimated Value
Purchase Details
Closed on
Aug 13, 2008
Sold by
Lee George C and Lee Edgar E
Bought by
Simons Chester
Purchase Details
Closed on
Sep 23, 2005
Sold by
Estate Of William E Lee
Bought by
Lee Edgar E and William E Lee Revocable Trust
Purchase Details
Closed on
Mar 18, 1996
Sold by
Vanduyn Nancy
Bought by
Lee George C and Lee William E
Create a Home Valuation Report for This Property
The Home Valuation Report is an in-depth analysis detailing your home's value as well as a comparison with similar homes in the area
Home Values in the Area
Average Home Value in this Area
Purchase History
| Date | Buyer | Sale Price | Title Company |
|---|---|---|---|
| Mata Management Llc | $40,000 | First American Title Ins Co | |
| Simons Chester | $4,800 | Attorney | |
| Lee Edgar E | -- | -- | |
| Lee George C | $34,000 | -- |
Source: Public Records
Tax History Compared to Growth
Tax History
| Year | Tax Paid | Tax Assessment Tax Assessment Total Assessment is a certain percentage of the fair market value that is determined by local assessors to be the total taxable value of land and additions on the property. | Land | Improvement |
|---|---|---|---|---|
| 2025 | $839 | $11,533 | $3,542 | $7,991 |
| 2024 | $839 | $11,533 | $3,542 | $7,991 |
| 2023 | $839 | $11,533 | $3,542 | $7,991 |
| 2022 | $686 | $6,784 | $2,083 | $4,701 |
| 2021 | $586 | $6,784 | $2,083 | $4,701 |
| 2020 | $679 | $6,780 | $2,080 | $4,700 |
| 2019 | $647 | $6,500 | $4,060 | $2,440 |
| 2018 | $641 | $6,500 | $4,060 | $2,440 |
| 2017 | $553 | $6,500 | $4,060 | $2,440 |
| 2016 | $603 | $6,560 | $4,060 | $2,500 |
| 2015 | $553 | $6,560 | $4,060 | $2,500 |
| 2014 | $549 | $6,560 | $4,060 | $2,500 |
| 2013 | $3,404 | $7,430 | $4,060 | $3,370 |
Source: Public Records
Map
Nearby Homes