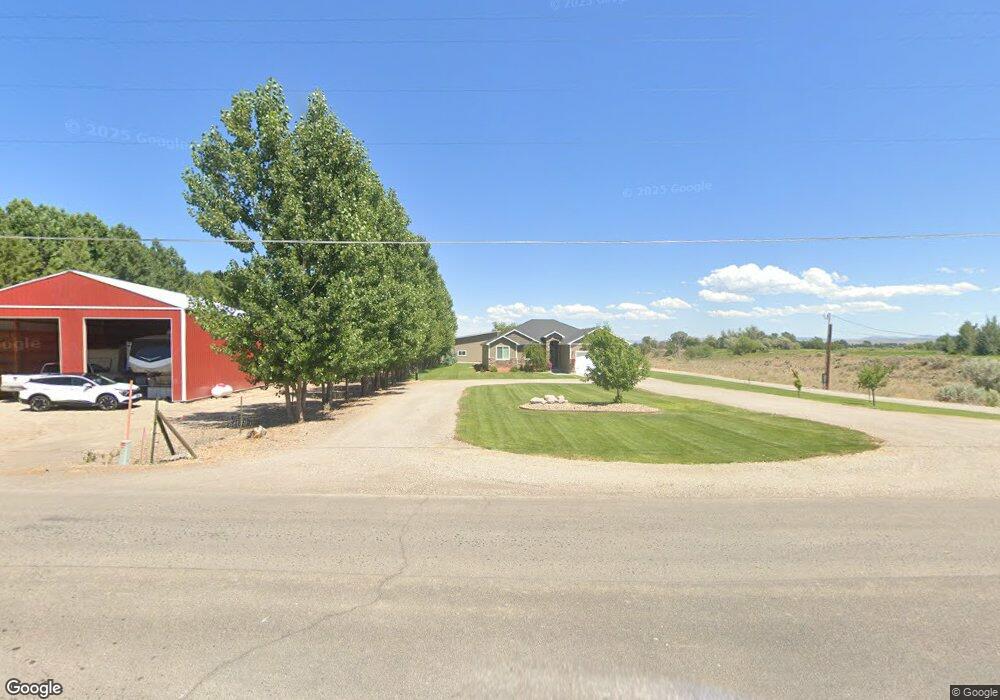
584 W 40 S Blackfoot, ID 83221
Estimated Value: $553,000 - $624,000
5
Beds
3
Baths
1,742
Sq Ft
$338/Sq Ft
Est. Value
About This Home
This home is located at 584 W 40 S, Blackfoot, ID 83221 and is currently estimated at $588,668, approximately $337 per square foot. 584 W 40 S is a home with nearby schools including Riverside Elementary School, Moreland Elementary School, and Rockford Elementary School.
Ownership History
Date
Name
Owned For
Owner Type
Purchase Details
Closed on
Nov 9, 2021
Sold by
Dale Almond Richard
Bought by
Almond Richard Dale and Almond Judy
Current Estimated Value
Home Financials for this Owner
Home Financials are based on the most recent Mortgage that was taken out on this home.
Original Mortgage
$250,000
Interest Rate
2.8%
Mortgage Type
New Conventional
Purchase Details
Closed on
Sep 27, 2021
Sold by
Almond Judy H and Almond Richard Dale
Bought by
Almond Richard Dale
Home Financials for this Owner
Home Financials are based on the most recent Mortgage that was taken out on this home.
Original Mortgage
$250,000
Interest Rate
2.8%
Mortgage Type
New Conventional
Purchase Details
Closed on
Sep 16, 2021
Sold by
Deer Meadows Development Llc
Bought by
Scott Briscoe Construction Llc
Home Financials for this Owner
Home Financials are based on the most recent Mortgage that was taken out on this home.
Original Mortgage
$250,000
Interest Rate
2.8%
Mortgage Type
New Conventional
Create a Home Valuation Report for This Property
The Home Valuation Report is an in-depth analysis detailing your home's value as well as a comparison with similar homes in the area
Home Values in the Area
Average Home Value in this Area
Purchase History
| Date | Buyer | Sale Price | Title Company |
|---|---|---|---|
| Almond Richard Dale | -- | None Listed On Document | |
| Almond Richard Dale | -- | Alliance Ttl Id Falls Office | |
| Scott Briscoe Construction Llc | -- | Alliance Title |
Source: Public Records
Mortgage History
| Date | Status | Borrower | Loan Amount |
|---|---|---|---|
| Previous Owner | Almond Richard Dale | $250,000 |
Source: Public Records
Tax History Compared to Growth
Tax History
| Year | Tax Paid | Tax Assessment Tax Assessment Total Assessment is a certain percentage of the fair market value that is determined by local assessors to be the total taxable value of land and additions on the property. | Land | Improvement |
|---|---|---|---|---|
| 2025 | $2,230 | $577,900 | $75,000 | $502,900 |
| 2024 | $2,230 | $550,700 | $60,000 | $490,700 |
| 2023 | $2,665 | $550,700 | $60,000 | $490,700 |
| 2022 | $4,939 | $476,550 | $60,000 | $416,550 |
| 2021 | $128 | $11,000 | $11,000 | $0 |
| 2020 | $115 | $9,000 | $0 | $0 |
Source: Public Records
Map
Nearby Homes