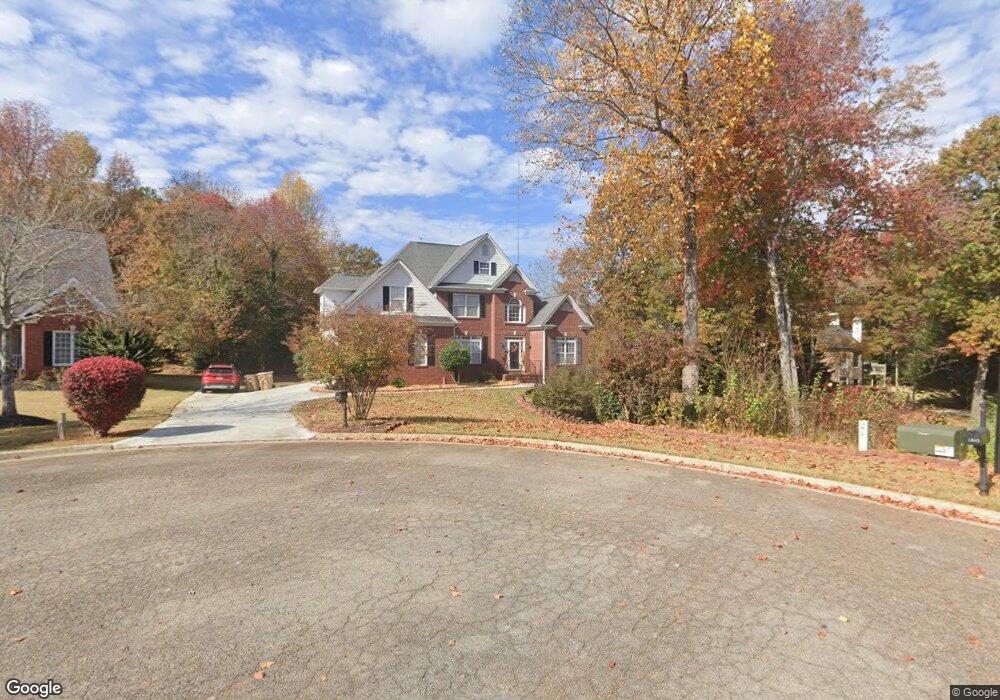
5840 Alpine Ct Unit 57 Hoschton, GA 30548
Estimated Value: $517,000 - $591,000
4
Beds
4
Baths
2,872
Sq Ft
$188/Sq Ft
Est. Value
About This Home
This home is located at 5840 Alpine Ct Unit 57, Hoschton, GA 30548 and is currently estimated at $539,009, approximately $187 per square foot. 5840 Alpine Ct Unit 57 is a home located in Hall County with nearby schools including Spout Springs Elementary School, Cherokee Bluff Middle School, and Cherokee Bluff High School.
Ownership History
Date
Name
Owned For
Owner Type
Purchase Details
Closed on
Feb 17, 2021
Sold by
Yang Rongbin
Bought by
Arp Jim and Arp Shiloh
Current Estimated Value
Home Financials for this Owner
Home Financials are based on the most recent Mortgage that was taken out on this home.
Original Mortgage
$342,678
Outstanding Balance
$305,086
Interest Rate
2.7%
Mortgage Type
FHA
Estimated Equity
$233,923
Purchase Details
Closed on
May 1, 2015
Sold by
Kim Yong Ki
Bought by
Yang Rongbin
Home Financials for this Owner
Home Financials are based on the most recent Mortgage that was taken out on this home.
Original Mortgage
$156,000
Interest Rate
5.75%
Mortgage Type
New Conventional
Purchase Details
Closed on
Feb 18, 2010
Sold by
Kim Yong K
Bought by
Urich Kenneth J and Urich Yong K
Purchase Details
Closed on
Feb 16, 2001
Sold by
Quality Builders Inc
Bought by
Kim Yong Ki
Purchase Details
Closed on
Aug 12, 1999
Sold by
Chandler-Hawkins Inc
Bought by
Quality Builders Inc
Create a Home Valuation Report for This Property
The Home Valuation Report is an in-depth analysis detailing your home's value as well as a comparison with similar homes in the area
Home Values in the Area
Average Home Value in this Area
Purchase History
| Date | Buyer | Sale Price | Title Company |
|---|---|---|---|
| Arp Jim | $349,000 | -- | |
| Yang Rongbin | $240,000 | -- | |
| Urich Kenneth J | -- | -- | |
| Kim Yong Ki | $223,000 | -- | |
| Quality Builders Inc | $90,000 | -- |
Source: Public Records
Mortgage History
| Date | Status | Borrower | Loan Amount |
|---|---|---|---|
| Open | Arp Jim | $342,678 | |
| Previous Owner | Yang Rongbin | $156,000 |
Source: Public Records
Tax History Compared to Growth
Tax History
| Year | Tax Paid | Tax Assessment Tax Assessment Total Assessment is a certain percentage of the fair market value that is determined by local assessors to be the total taxable value of land and additions on the property. | Land | Improvement |
|---|---|---|---|---|
| 2025 | $4,517 | $182,880 | $23,520 | $159,360 |
| 2024 | $4,601 | $179,960 | $23,520 | $156,440 |
| 2023 | $4,452 | $173,720 | $23,520 | $150,200 |
| 2022 | $3,752 | $144,480 | $23,520 | $120,960 |
| 2021 | $4,011 | $146,840 | $23,520 | $123,320 |
| 2020 | $3,661 | $129,640 | $11,000 | $118,640 |
| 2019 | $3,582 | $125,600 | $11,000 | $114,600 |
| 2018 | $3,608 | $122,440 | $11,000 | $111,440 |
| 2017 | $3,264 | $111,680 | $11,000 | $100,680 |
| 2016 | $2,758 | $111,640 | $11,000 | $100,640 |
| 2015 | $1,009 | $106,931 | $11,000 | $95,931 |
| 2014 | $1,009 | $106,931 | $11,000 | $95,931 |
Source: Public Records
Map
Nearby Homes
- 6420 Rockpoint Ln
- 6146 Brookside Ln Unit 3
- 6352 Falling Water Ln Unit 6A
- 5916 Flagstone Cir
- 6416 Hickory Springs Cir Unit 6A
- 1661 Friendship Rd
- 6303 Rockpoint Ln
- 5935 Chimney Rock Dr
- 5944 Bellflower Way
- 5921 Bellflower Way
- 5960 Chimney Rock Dr
- 5757 Chateau Glen Dr
- 6707 Amherst Dr
- 6614 Covered Bridge Way
- 5947 Maple Bluff Way
- 6503 Grove Park Dr
- 5703 Community Ln
- 6220 Ivy Stone Way
- 6443 Autumn Crest Ln
- 5952 Ventura Place
- 5840 Alpine Ct
- 5845 Alpine Ct
- 5934 Legend Ct
- 5846 Alpine Ct
- 5949 Legend Ct
- 5861 Paris Ln
- 5851 Alpine Ct
- 5857 Alpine Ct
- 5943 Legend Ct
- 5928 Legend Ct
- 5746 Corners Dr
- 5740 Corners Dr
- 5863 Alpine Ct
- 6330 Scenic View Dr Unit 4A
- 5937 Legend Ct
- 5860 Paris Ln
- 5752 Corners Dr
- 6326 Scenic View Dr
- 5734 Corners Dr Unit 54
- 5734 Corners Dr