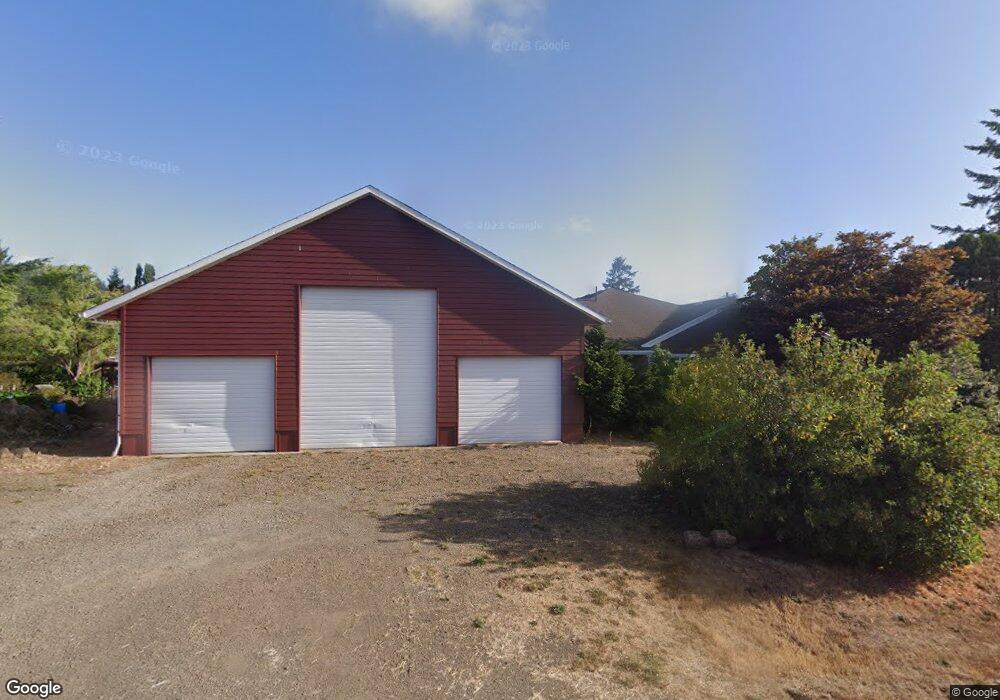
5840 Brickyard Rd Tillamook, OR 97141
Estimated Value: $442,000 - $520,000
3
Beds
2
Baths
1,654
Sq Ft
$290/Sq Ft
Est. Value
About This Home
This home is located at 5840 Brickyard Rd, Tillamook, OR 97141 and is currently estimated at $479,417, approximately $289 per square foot. 5840 Brickyard Rd is a home located in Tillamook County with nearby schools including Tillamook High School and Hendrickson Academy.
Ownership History
Date
Name
Owned For
Owner Type
Purchase Details
Closed on
Jan 11, 2010
Sold by
U S Bank National Association
Bought by
Thomas Clair O and Thomas Patricia M
Current Estimated Value
Purchase Details
Closed on
May 19, 2006
Sold by
Robertson Russell C
Bought by
May Thomas Clair O and May Thomas Patricia
Purchase Details
Closed on
May 5, 2005
Sold by
Robertson Russell C
Bought by
Robertson Russell C
Home Financials for this Owner
Home Financials are based on the most recent Mortgage that was taken out on this home.
Original Mortgage
$106,000
Interest Rate
5.61%
Mortgage Type
New Conventional
Purchase Details
Closed on
Mar 17, 2005
Sold by
Robertson Russell and Robertson Shara L
Bought by
Robertson Russell C
Home Financials for this Owner
Home Financials are based on the most recent Mortgage that was taken out on this home.
Original Mortgage
$106,000
Interest Rate
5.61%
Mortgage Type
New Conventional
Create a Home Valuation Report for This Property
The Home Valuation Report is an in-depth analysis detailing your home's value as well as a comparison with similar homes in the area
Home Values in the Area
Average Home Value in this Area
Purchase History
| Date | Buyer | Sale Price | Title Company |
|---|---|---|---|
| Thomas Clair O | $95,000 | Pacific Northwest Title Of O | |
| May Thomas Clair O | $239,900 | Fidelity Natl Title Co Of Or | |
| Robertson Russell C | -- | -- | |
| Robertson Russell C | -- | First American |
Source: Public Records
Mortgage History
| Date | Status | Borrower | Loan Amount |
|---|---|---|---|
| Previous Owner | Robertson Russell C | $106,000 |
Source: Public Records
Tax History Compared to Growth
Tax History
| Year | Tax Paid | Tax Assessment Tax Assessment Total Assessment is a certain percentage of the fair market value that is determined by local assessors to be the total taxable value of land and additions on the property. | Land | Improvement |
|---|---|---|---|---|
| 2024 | $2,419 | $242,860 | $70,170 | $172,690 |
| 2023 | $2,406 | $235,790 | $68,130 | $167,660 |
| 2022 | $2,321 | $228,930 | $66,150 | $162,780 |
| 2021 | $2,252 | $222,270 | $64,220 | $158,050 |
| 2020 | $2,191 | $215,800 | $62,350 | $153,450 |
| 2019 | $2,136 | $209,520 | $60,530 | $148,990 |
| 2018 | $2,082 | $203,420 | $58,770 | $144,650 |
| 2017 | $2,031 | $197,500 | $57,060 | $140,440 |
| 2016 | $1,952 | $191,750 | $55,400 | $136,350 |
| 2015 | $1,915 | $186,170 | $53,790 | $132,380 |
| 2014 | $1,887 | $180,750 | $52,220 | $128,530 |
| 2013 | -- | $175,490 | $50,700 | $124,790 |
Source: Public Records
Map
Nearby Homes
- 9225 Mill Creek Rd
- 9225 Millcreek Rd
- 7400 S Prairie Rd
- 9065 Trask River Rd
- 0 Edelwyss Rd Unit TL 405 25-357
- 0 Edelwyss Rd Unit 405 731536279
- 6500 Weber Rd
- 0 Valley View Dr Unit 24275744
- 1690 Skyline Dr
- 11605 Oregon Coast Hwy
- 11605 Highway 101 S
- 01400 Blaser Ln
- TL #01400 Blaser Ln
- 10360 Skyview Rd
- 0 Skyview Rd Unit 41 424877504
- 0 Skyview Rd Unit 410604 427457611
- 810 Marvin Rd
- 6205 Munson Creek Rd
- 650 Marvin Rd
- 5305 Kenway Dr
- 5800 Brickyard Rd
- 5925 Brickyard Rd
- 5970 Brickyard Rd
- 8435 Magnolia Dr
- 8395 Magnolia Dr
- 5785 Brickyard Rd
- 8355 Magnolia Dr
- 8325 Magnolia Dr
- 8475 Magnolia Dr
- 6000 Brickyard Rd
- 6035 Brickyard Rd
- 8285 Magnolia Dr
- 6045 Brickyard Rd Unit South Prairie
- 5865 Brickyard Rd
- 8400 Magnolia Dr
- 8440 Magnolia Dr
- 8360 Magnolia Dr
- 8480 Magnolia Dr
- 6095 Brickyard Rd
- 8300 Magnolia Dr