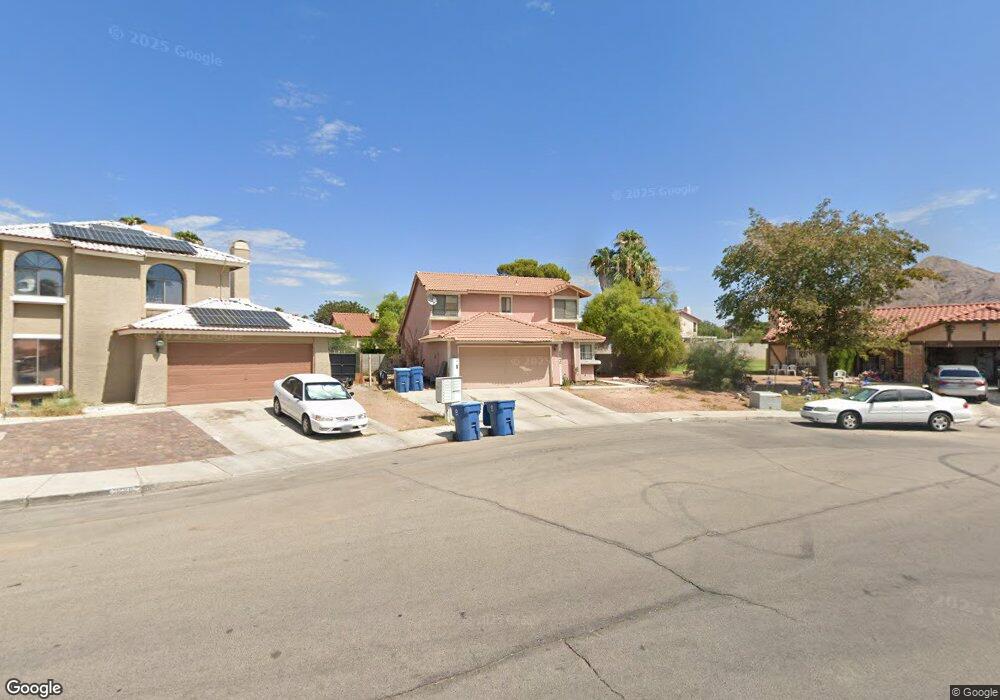
5840 Cedar Ave Las Vegas, NV 89110
Estimated Value: $392,000 - $404,241
3
Beds
3
Baths
1,393
Sq Ft
$285/Sq Ft
Est. Value
About This Home
This home is located at 5840 Cedar Ave, Las Vegas, NV 89110 and is currently estimated at $396,560, approximately $284 per square foot. 5840 Cedar Ave is a home located in Clark County with nearby schools including Richard J. Rundle Elementary School, Charlotte & Jerry Keller Elementary School, and Duane D. Keller Middle School.
Ownership History
Date
Name
Owned For
Owner Type
Purchase Details
Closed on
Dec 20, 2002
Sold by
Calderson Paul and Blackmer Robert T
Bought by
Rico Salvador and Granillo Rebecca
Current Estimated Value
Home Financials for this Owner
Home Financials are based on the most recent Mortgage that was taken out on this home.
Original Mortgage
$140,298
Outstanding Balance
$56,429
Interest Rate
5.86%
Mortgage Type
FHA
Estimated Equity
$340,131
Purchase Details
Closed on
Apr 2, 1996
Sold by
Calderon Paul
Bought by
Calderon Paul and Blackmer Robert T
Home Financials for this Owner
Home Financials are based on the most recent Mortgage that was taken out on this home.
Original Mortgage
$7,362
Interest Rate
7.34%
Purchase Details
Closed on
Feb 26, 1996
Sold by
Blackmer Robert T
Bought by
Calderon Paul
Home Financials for this Owner
Home Financials are based on the most recent Mortgage that was taken out on this home.
Original Mortgage
$7,362
Interest Rate
7.34%
Create a Home Valuation Report for This Property
The Home Valuation Report is an in-depth analysis detailing your home's value as well as a comparison with similar homes in the area
Home Values in the Area
Average Home Value in this Area
Purchase History
| Date | Buyer | Sale Price | Title Company |
|---|---|---|---|
| Rico Salvador | $142,500 | Equity Title | |
| Calderon Paul | $23,000 | Nevada Title Company | |
| Calderon Paul | -- | Ati Title |
Source: Public Records
Mortgage History
| Date | Status | Borrower | Loan Amount |
|---|---|---|---|
| Open | Rico Salvador | $140,298 | |
| Previous Owner | Calderon Paul | $7,362 | |
| Previous Owner | Calderon Paul | $102,700 |
Source: Public Records
Tax History
| Year | Tax Paid | Tax Assessment Tax Assessment Total Assessment is a certain percentage of the fair market value that is determined by local assessors to be the total taxable value of land and additions on the property. | Land | Improvement |
|---|---|---|---|---|
| 2026 | $1,282 | $71,164 | $29,750 | $41,414 |
| 2025 | $1,244 | $70,457 | $27,300 | $43,157 |
| 2024 | $1,209 | $70,457 | $27,300 | $43,157 |
| 2023 | $1,209 | $72,028 | $30,450 | $41,578 |
| 2022 | $1,286 | $62,599 | $24,150 | $38,449 |
| 2021 | $1,191 | $57,932 | $21,000 | $36,932 |
| 2020 | $1,103 | $58,085 | $21,000 | $37,085 |
| 2019 | $1,034 | $54,317 | $17,500 | $36,817 |
| 2018 | $987 | $51,058 | $15,400 | $35,658 |
| 2017 | $1,428 | $48,682 | $12,250 | $36,432 |
| 2016 | $925 | $42,881 | $8,050 | $34,831 |
| 2015 | $922 | $42,425 | $6,650 | $35,775 |
| 2014 | $895 | $33,867 | $4,550 | $29,317 |
Source: Public Records
Map
Nearby Homes
- 5832 Sutcliffe Cir
- 5612 Super Bowl Dr
- 5854 Dana Rogers Dr
- 5976 Stewart Ave
- 5681 Coaldale Place
- 372 Linn Ln
- 563 Moon Chase St
- 683 Vermeer St
- 506 Wheaties Way
- 5639 Reuben St
- 326 Linn Ln
- 940 N Sloan Ln Unit 201M
- 304 N Linn Ln
- 0 Washington Unit 2360795
- 0 Madge Ln
- 5939 Samia Ct
- 6018 Halehaven Dr
- 360 N Sir Richard Dr
- 330 N Sir Richard Dr
- 431 N Fogg St
- 5841 Butterum Ct
- 5850 Cedar Ave
- 5851 Butterum Ct
- 5831 Butterum Ct
- 598 Searchlight Dr Unit n/a
- 598 Searchlight Dr
- 620 Summer Heights Ln
- 630 Summer Heights Ln
- 630 Summer Heights Ln Unit na
- 5861 Butterum Ct
- 594 Searchlight Dr
- 5845 Cedar Ave
- 5845 Cedar Ave Unit n/a
- 640 Summer Heights Ln
- 5839 Cedar Ave Unit SFR
- 5839 Cedar Ave
- 588 Searchlight Dr Unit 5
- 5833 Cedar Ave
- 5852 Butterum Ct
Your Personal Tour Guide
Ask me questions while you tour the home.