5840 Hallridge Cir Columbus, OH 43232
Livingston-McNaughten NeighborhoodEstimated Value: $108,000 - $118,000
1
Bed
1
Bath
788
Sq Ft
$145/Sq Ft
Est. Value
About This Home
This home is located at 5840 Hallridge Cir, Columbus, OH 43232 and is currently estimated at $113,998, approximately $144 per square foot. 5840 Hallridge Cir is a home located in Franklin County with nearby schools including Oakmont Elementary School, Yorktown Middle School, and Independence High School.
Ownership History
Date
Name
Owned For
Owner Type
Purchase Details
Closed on
May 14, 2025
Sold by
Kreuz Szeren and Varin Szeren
Bought by
Koskey Matthew A
Current Estimated Value
Purchase Details
Closed on
Feb 2, 2017
Sold by
Kary Szeren A and Kreuz Szeren
Bought by
Kreuz Daniel P and Kreuz Szeren
Purchase Details
Closed on
Sep 28, 2001
Sold by
Shaffer Joni R
Bought by
Kary Szeren A
Home Financials for this Owner
Home Financials are based on the most recent Mortgage that was taken out on this home.
Original Mortgage
$21,200
Interest Rate
6.99%
Purchase Details
Closed on
Sep 1, 1995
Sold by
Martin Ellen J
Bought by
Joni R Shaffer
Home Financials for this Owner
Home Financials are based on the most recent Mortgage that was taken out on this home.
Original Mortgage
$29,200
Interest Rate
7.55%
Mortgage Type
New Conventional
Purchase Details
Closed on
Mar 1, 1980
Create a Home Valuation Report for This Property
The Home Valuation Report is an in-depth analysis detailing your home's value as well as a comparison with similar homes in the area
Home Values in the Area
Average Home Value in this Area
Purchase History
| Date | Buyer | Sale Price | Title Company |
|---|---|---|---|
| Koskey Matthew A | $116,700 | Valmer Land Title | |
| Kreuz Daniel P | -- | None Available | |
| Kary Szeren A | $26,500 | Darby Creek Title Agency Ltd | |
| Joni R Shaffer | $29,250 | -- | |
| -- | $25,100 | -- |
Source: Public Records
Mortgage History
| Date | Status | Borrower | Loan Amount |
|---|---|---|---|
| Previous Owner | Kary Szeren A | $21,200 | |
| Previous Owner | Joni R Shaffer | $29,200 |
Source: Public Records
Tax History Compared to Growth
Tax History
| Year | Tax Paid | Tax Assessment Tax Assessment Total Assessment is a certain percentage of the fair market value that is determined by local assessors to be the total taxable value of land and additions on the property. | Land | Improvement |
|---|---|---|---|---|
| 2024 | $2,790 | $20,580 | $4,200 | $16,380 |
| 2023 | $931 | $20,580 | $4,200 | $16,380 |
| 2022 | $683 | $12,850 | $2,280 | $10,570 |
| 2021 | $684 | $12,850 | $2,280 | $10,570 |
| 2020 | $685 | $12,850 | $2,280 | $10,570 |
| 2019 | $614 | $9,870 | $1,750 | $8,120 |
| 2018 | $306 | $9,870 | $1,750 | $8,120 |
| 2017 | $614 | $9,870 | $1,750 | $8,120 |
| 2016 | $518 | $7,630 | $1,120 | $6,510 |
| 2015 | $236 | $7,630 | $1,120 | $6,510 |
| 2014 | $473 | $7,630 | $1,120 | $6,510 |
| 2013 | $334 | $10,920 | $1,610 | $9,310 |
Source: Public Records
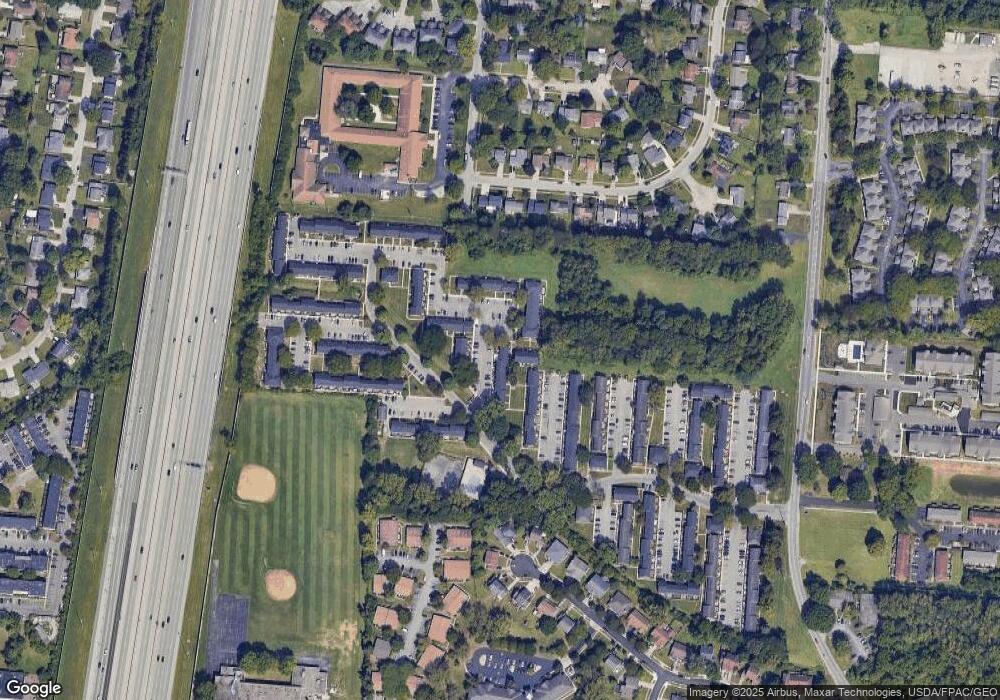
Map
Nearby Homes
- 5781 Hallridge Cir Unit B
- 5794 Hallridge Cir
- 1481 Riverton Ct E
- 1603 Hallworth Ct Unit 16038
- 5750 Hallridge Cir
- 5596 Autumn Chase Dr
- 1826-1828 Bairsford Dr
- 1334 Manor Dr
- 1888 Birkdale Dr
- 1328 Manor Dr
- 5366 Yorkshire Village Ln Unit B-22
- 1550 Idlewild Dr
- 0 Radekin Rd Unit 225029852
- 1759 Lonsdale Rd
- 1324 Idlewild Dr
- 1624 Coppertree Ln
- 1859 Woodette Rd
- 1942 Bairsford Dr Unit 944
- 5337 Ivyhurst Dr
- 0 Brice Rd
- 5844 Hallridge Cir Unit D
- 5842 Hallridge Cir Unit D
- 5840 Hallridge Cir Unit B
- 5840 Hallridge Cir
- 5842 Hallridge Cir
- 5838 Hallridge Cir Unit C
- 5868 Hallworth Ave
- 5844 Hallridge Cir
- 5838 Hallridge Cir Unit A
- 5842 Hallridge Cir
- 5838 Hallridge Cir
- 5840 Hallridge Cir Unit 5840D
- 5868 Hallworth Ave Unit 5868B
- 5844 Hallridge Cir Unit B
- 5842 Hallridge Cir Unit A
- 5838 Hallridge Cir Unit B
- 5842 Hallridge Cir Unit ''C''
- 5868 Hallworth Ave Unit A
- 5838 Hallridge Cir Unit 5838-D
- 5868 Hallworth Ave Unit B