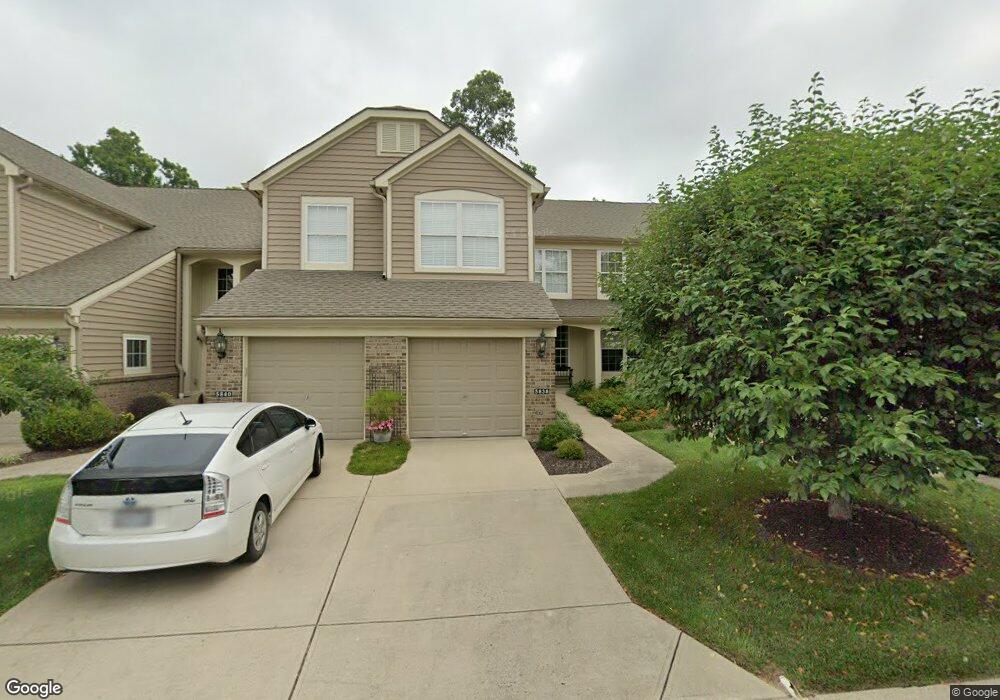
5840 Stonebridge Cir Unit 32302 Milford, OH 45150
Estimated Value: $277,858 - $313,000
2
Beds
2
Baths
1,848
Sq Ft
$160/Sq Ft
Est. Value
About This Home
This home is located at 5840 Stonebridge Cir Unit 32302, Milford, OH 45150 and is currently estimated at $295,215, approximately $159 per square foot. 5840 Stonebridge Cir Unit 32302 is a home located in Clermont County with nearby schools including Milford Senior High School, St. Andrew - St. Elizabeth Ann Seton School, and St. Mark's Lutheran School.
Ownership History
Date
Name
Owned For
Owner Type
Purchase Details
Closed on
Mar 21, 2024
Sold by
Ball Carol G
Bought by
Carol G Ball Family Trust and Ball
Current Estimated Value
Purchase Details
Closed on
Feb 26, 2018
Sold by
Us Bank Trust Na
Bought by
Ball Carol G
Home Financials for this Owner
Home Financials are based on the most recent Mortgage that was taken out on this home.
Original Mortgage
$144,000
Interest Rate
4.4%
Mortgage Type
New Conventional
Purchase Details
Closed on
Sep 14, 2017
Sold by
Clermont County Sheriff
Bought by
Us Bank Na Trsutee
Purchase Details
Closed on
Feb 9, 2004
Sold by
Fischer Attached Homes Ltd
Bought by
Yingling Robert J and Yingling Tammy S
Home Financials for this Owner
Home Financials are based on the most recent Mortgage that was taken out on this home.
Original Mortgage
$133,938
Interest Rate
2.37%
Mortgage Type
Purchase Money Mortgage
Create a Home Valuation Report for This Property
The Home Valuation Report is an in-depth analysis detailing your home's value as well as a comparison with similar homes in the area
Home Values in the Area
Average Home Value in this Area
Purchase History
| Date | Buyer | Sale Price | Title Company |
|---|---|---|---|
| Carol G Ball Family Trust | -- | None Listed On Document | |
| Ball Carol G | $180,000 | -- | |
| Us Bank Na Trsutee | $140,000 | -- | |
| Yingling Robert J | $148,900 | Homestead Title Agency Ltd |
Source: Public Records
Mortgage History
| Date | Status | Borrower | Loan Amount |
|---|---|---|---|
| Previous Owner | Ball Carol G | $144,000 | |
| Previous Owner | Yingling Robert J | $133,938 |
Source: Public Records
Tax History Compared to Growth
Tax History
| Year | Tax Paid | Tax Assessment Tax Assessment Total Assessment is a certain percentage of the fair market value that is determined by local assessors to be the total taxable value of land and additions on the property. | Land | Improvement |
|---|---|---|---|---|
| 2024 | $3,296 | $70,570 | $4,310 | $66,260 |
| 2023 | $3,330 | $70,570 | $4,310 | $66,260 |
| 2022 | $3,627 | $58,520 | $3,570 | $54,950 |
| 2021 | $3,631 | $58,520 | $3,570 | $54,950 |
| 2020 | $3,484 | $58,520 | $3,570 | $54,950 |
| 2019 | $3,262 | $52,020 | $3,540 | $48,480 |
| 2018 | $3,263 | $52,020 | $3,540 | $48,480 |
| 2017 | $3,016 | $52,020 | $3,540 | $48,480 |
| 2016 | $3,016 | $43,720 | $2,980 | $40,740 |
| 2015 | $2,819 | $43,720 | $2,980 | $40,740 |
| 2014 | $2,819 | $43,720 | $2,980 | $40,740 |
| 2013 | $2,907 | $43,720 | $2,980 | $40,740 |
Source: Public Records
Map
Nearby Homes
- 5612 Flagstone Way
- 5880 Stonebridge Cir
- 5884 Stonebridge Cir
- 772 Price Knoll Ln
- 957 Tarragon Ln
- 5897 Cook Rd
- 977 Newberry Ave
- 1010 Newberry Ave
- 1706 Cottontail Dr
- 1007 Valley View Dr
- 732 St Rt 28
- 1093 Broadview Place
- 5763 Price Rd
- 5702 Sherwood Dr
- 221 Miami Lakes Dr
- 826 Ohio 131
- 1139 Willowwood Dr
- 5 White Water Way
- 6211 Cook Rd
- 2403 Traverse Creek Dr
- 5840 Stonebridge Cir
- 5840 Stonebridge Cir Unit 32G3
- 5836 Stonebridge Cir
- 5836 Stonebridge Cir Unit 32203
- 5834 Stonebridge Cir
- 5834 Stonebridge Cir Unit 32G6
- 5834 Stonebridge Cir Unit 32303
- 5842 Stonebridge Cir Unit 32G2
- 5842 Stonebridge Cir Unit 32301
- 5844 Stonebridge Cir Unit 32G1
- 5844 Stonebridge Cir Unit 32201
- 5832 Stonebridge Cir Unit 32G7
- 5832 Stonebridge Cir Unit 32304
- 5832 Stonebridge Cir
- 5830 Stonebridge Cir Unit 32G8
- 5830 Stonebridge Cir Unit 32204
- 5830 Stonebridge Cir
- 5826 Stonebridge Cir
- 5826 Stonebridge Cir Unit 31301
- 1000 Birdhaven Way Unit 33G1