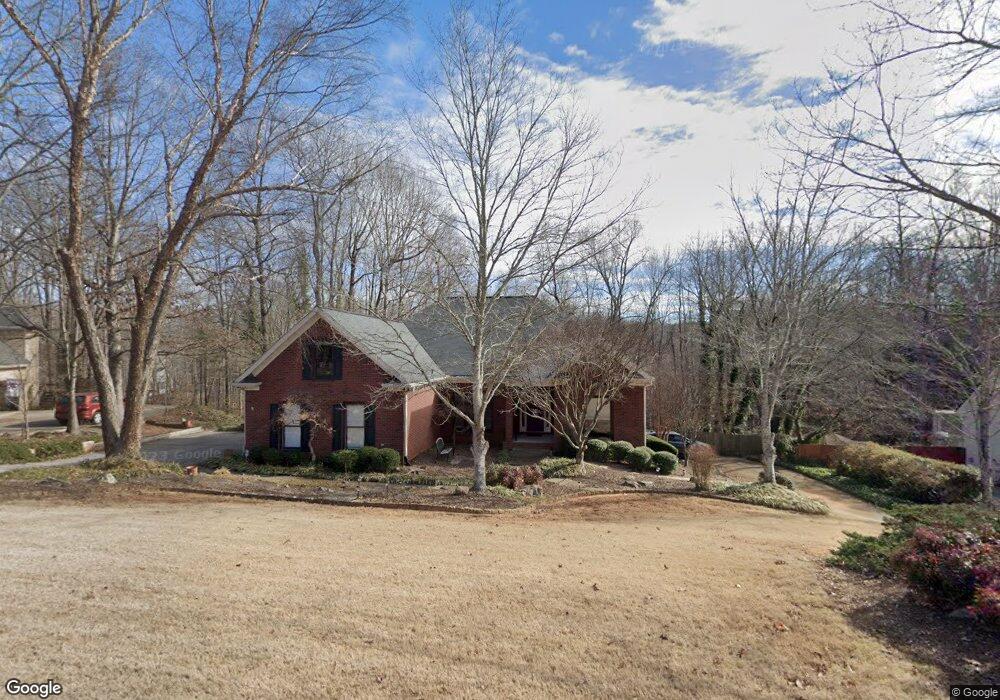
5842 Bayside Ct Buford, GA 30518
Estimated Value: $508,000 - $581,000
4
Beds
3
Baths
2,629
Sq Ft
$205/Sq Ft
Est. Value
About This Home
This home is located at 5842 Bayside Ct, Buford, GA 30518 and is currently estimated at $537,637, approximately $204 per square foot. 5842 Bayside Ct is a home located in Hall County with nearby schools including Friendship Elementary School, C.W. Davis Middle School, and Flowery Branch High School.
Ownership History
Date
Name
Owned For
Owner Type
Purchase Details
Closed on
Apr 26, 2016
Sold by
Bendig Lisa Michelle
Bought by
Bendig Ronald J
Current Estimated Value
Purchase Details
Closed on
Jul 17, 2003
Sold by
Bendig Ronald J
Bought by
Bendig Ronald J and Bendig Lisa M
Home Financials for this Owner
Home Financials are based on the most recent Mortgage that was taken out on this home.
Original Mortgage
$201,400
Interest Rate
5.74%
Mortgage Type
Stand Alone Second
Purchase Details
Closed on
Jul 15, 2002
Sold by
Duchemin Henry J and Duchemin Eleanor
Bought by
Bendig Ronald J
Home Financials for this Owner
Home Financials are based on the most recent Mortgage that was taken out on this home.
Original Mortgage
$200,000
Interest Rate
7%
Mortgage Type
New Conventional
Purchase Details
Closed on
Mar 29, 1996
Sold by
Hardin Sons Builders Inc
Bought by
Duchemin Henry Eleanor
Purchase Details
Closed on
Dec 1, 1995
Create a Home Valuation Report for This Property
The Home Valuation Report is an in-depth analysis detailing your home's value as well as a comparison with similar homes in the area
Home Values in the Area
Average Home Value in this Area
Purchase History
| Date | Buyer | Sale Price | Title Company |
|---|---|---|---|
| Bendig Ronald J | -- | -- | |
| Bendig Ronald J | -- | -- | |
| Bendig Ronald J | $260,000 | -- | |
| Duchemin Henry Eleanor | $174,000 | -- | |
| -- | $32,000 | -- |
Source: Public Records
Mortgage History
| Date | Status | Borrower | Loan Amount |
|---|---|---|---|
| Previous Owner | Bendig Ronald J | $201,400 | |
| Previous Owner | Bendig Ronald J | $200,000 | |
| Closed | Duchemin Henry Eleanor | $0 |
Source: Public Records
Tax History Compared to Growth
Tax History
| Year | Tax Paid | Tax Assessment Tax Assessment Total Assessment is a certain percentage of the fair market value that is determined by local assessors to be the total taxable value of land and additions on the property. | Land | Improvement |
|---|---|---|---|---|
| 2024 | $3,853 | $152,560 | $33,040 | $119,520 |
| 2023 | $3,333 | $146,760 | $31,800 | $114,960 |
| 2022 | $3,423 | $130,400 | $31,800 | $98,600 |
| 2021 | $3,186 | $119,120 | $22,880 | $96,240 |
| 2020 | $3,351 | $121,880 | $15,360 | $106,520 |
| 2019 | $3,307 | $119,200 | $15,360 | $103,840 |
| 2018 | $2,940 | $102,360 | $11,720 | $90,640 |
| 2017 | $2,299 | $94,600 | $11,720 | $82,880 |
| 2016 | $2,418 | $86,760 | $11,200 | $75,560 |
| 2015 | $2,427 | $86,760 | $11,200 | $75,560 |
| 2014 | $2,427 | $86,760 | $11,200 | $75,560 |
Source: Public Records
Map
Nearby Homes
- 5832 Bay View Dr
- 5862 Bay View Dr
- 5885 Bay View Dr
- 5775 Lakeshore Dr
- 5839 Lakeshore Dr
- 5574 Lanier Islands Pkwy
- 6119 Bethany View Trail
- 6205 Bridgewood Dr
- 6225 Bridgewood Dr
- 6558 Lanier Islands Pkwy
- 5697 Frontier Walk Ln
- 6030 Chimney Springs Rd
- 2610 Buford Dam Rd
- 5989 Lanier Islands Pkwy
- 5904 Basswood Cove
- 3617 Shoreland Dr
- 2482 Windchase Ct
- 5838 Bayside Ct Unit 23
- 5838 Bayside Ct
- 5846 Bayside Ct
- 5850 Bayside Ct
- 5839 Bayside Ct
- 5843 Bayside Ct
- 5834 Bayside Ct
- 5835 Bayside Ct
- 5831 Bayside Ct
- 5831 Bayside Ct
- 5831 Bayside Ct Unit 5831
- 6004 Island View Dr
- 5820 County Ct
- 5997 Island View Dr
- 5826 Bayside Ct
- 5816 County Ct
- 5840 Bay View Dr
- 5844 Bay View Dr
- 5836 Bay View Dr
- 5827 Bayside Ct