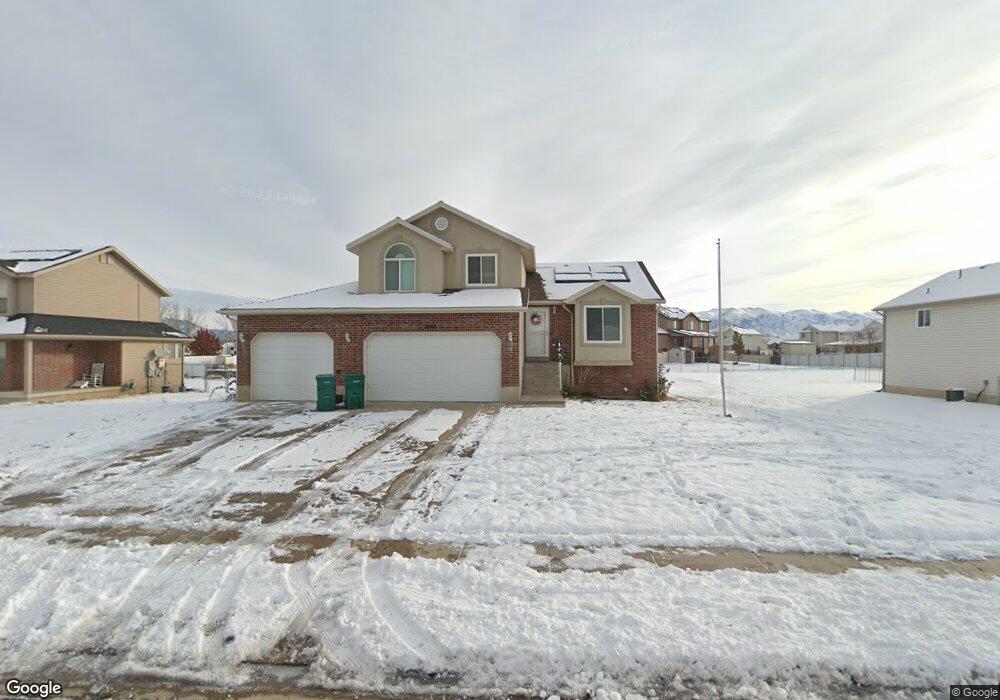
5842 S 4300 W Hooper, UT 84315
Estimated Value: $511,000 - $571,000
3
Beds
3
Baths
2,130
Sq Ft
$255/Sq Ft
Est. Value
About This Home
This home is located at 5842 S 4300 W, Hooper, UT 84315 and is currently estimated at $543,850, approximately $255 per square foot. 5842 S 4300 W is a home located in Weber County with nearby schools including Freedom School, Roy Junior High School, and Roy High School.
Ownership History
Date
Name
Owned For
Owner Type
Purchase Details
Closed on
Apr 27, 2022
Sold by
Smith Daniel L and Smith Anna I
Bought by
Espinoza Gusman and Espinoza Angela
Current Estimated Value
Purchase Details
Closed on
Jul 11, 2003
Sold by
Hearty Homes Inc
Bought by
Smith Daniel L and Smith Anna I
Home Financials for this Owner
Home Financials are based on the most recent Mortgage that was taken out on this home.
Original Mortgage
$164,118
Interest Rate
5.18%
Mortgage Type
VA
Purchase Details
Closed on
Jan 17, 2003
Sold by
D&R Development Llc
Bought by
Ivins Kevin R
Home Financials for this Owner
Home Financials are based on the most recent Mortgage that was taken out on this home.
Original Mortgage
$117,000
Interest Rate
5.96%
Mortgage Type
Construction
Create a Home Valuation Report for This Property
The Home Valuation Report is an in-depth analysis detailing your home's value as well as a comparison with similar homes in the area
Home Values in the Area
Average Home Value in this Area
Purchase History
| Date | Buyer | Sale Price | Title Company |
|---|---|---|---|
| Espinoza Gusman | -- | Investors Title | |
| Smith Daniel L | -- | Heritage West | |
| Ivins Kevin R | -- | Bonneville Title |
Source: Public Records
Mortgage History
| Date | Status | Borrower | Loan Amount |
|---|---|---|---|
| Previous Owner | Smith Daniel L | $164,118 | |
| Previous Owner | Ivins Kevin R | $117,000 |
Source: Public Records
Tax History
| Year | Tax Paid | Tax Assessment Tax Assessment Total Assessment is a certain percentage of the fair market value that is determined by local assessors to be the total taxable value of land and additions on the property. | Land | Improvement |
|---|---|---|---|---|
| 2025 | $3,116 | $497,966 | $171,375 | $326,591 |
| 2024 | $3,044 | $269,499 | $94,256 | $175,243 |
| 2023 | $3,081 | $274,450 | $91,882 | $182,568 |
| 2022 | $3,061 | $279,400 | $74,190 | $205,210 |
| 2021 | $1,733 | $398,000 | $92,175 | $305,825 |
| 2020 | $1,476 | $339,000 | $92,175 | $246,825 |
| 2019 | $1,350 | $308,000 | $60,485 | $247,515 |
| 2018 | $1,632 | $287,000 | $60,485 | $226,515 |
| 2017 | $1,440 | $250,000 | $60,485 | $189,515 |
| 2016 | $1,255 | $123,053 | $32,231 | $90,822 |
| 2015 | $1,190 | $120,760 | $32,231 | $88,529 |
| 2014 | $1,210 | $120,760 | $32,231 | $88,529 |
Source: Public Records
Map
Nearby Homes
Your Personal Tour Guide
Ask me questions while you tour the home.