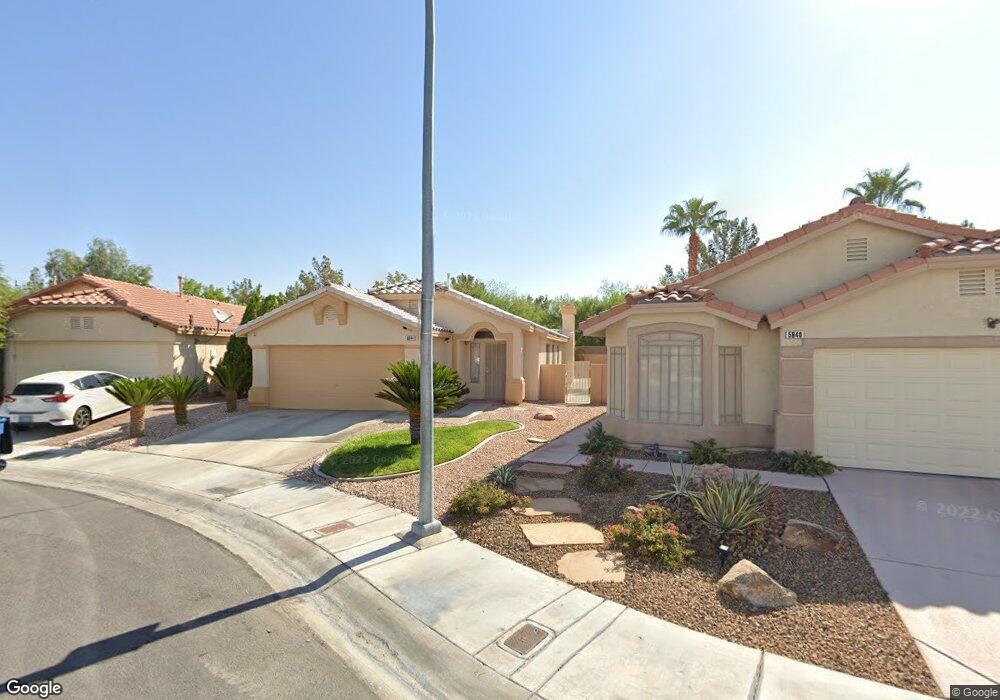
5844 Drift Boat St Las Vegas, NV 89149
Estimated Value: $365,000 - $406,000
3
Beds
2
Baths
1,303
Sq Ft
$296/Sq Ft
Est. Value
About This Home
This home is located at 5844 Drift Boat St, Las Vegas, NV 89149 and is currently estimated at $386,033, approximately $296 per square foot. 5844 Drift Boat St is a home located in Clark County with nearby schools including Dean Lamar Allen Elementary School, Edmundo "Eddie" Escobedo, Sr. Middle School, and Centennial High School.
Ownership History
Date
Name
Owned For
Owner Type
Purchase Details
Closed on
Jan 6, 2025
Sold by
Parker Jonetta T and Parker Patrick L
Bought by
Williams-Parker Jonetta T and Parker Patrick L
Current Estimated Value
Purchase Details
Closed on
Jun 16, 1999
Sold by
Parker Patrick L
Bought by
Parker Patrick L and Parker Jonetta T
Purchase Details
Closed on
May 19, 1999
Sold by
Parker Jonetta
Bought by
Parker Patrick L
Home Financials for this Owner
Home Financials are based on the most recent Mortgage that was taken out on this home.
Original Mortgage
$116,858
Interest Rate
6.92%
Mortgage Type
FHA
Purchase Details
Closed on
Mar 26, 1999
Sold by
Woodside Homes Of Nevada Inc
Bought by
Parker Patrick L
Home Financials for this Owner
Home Financials are based on the most recent Mortgage that was taken out on this home.
Original Mortgage
$116,858
Interest Rate
6.92%
Mortgage Type
FHA
Create a Home Valuation Report for This Property
The Home Valuation Report is an in-depth analysis detailing your home's value as well as a comparison with similar homes in the area
Home Values in the Area
Average Home Value in this Area
Purchase History
| Date | Buyer | Sale Price | Title Company |
|---|---|---|---|
| Williams-Parker Jonetta T | -- | None Listed On Document | |
| Parker Patrick L | -- | -- | |
| Parker Patrick L | -- | First American Title Co | |
| Parker Patrick L | $117,500 | First American Title Co |
Source: Public Records
Mortgage History
| Date | Status | Borrower | Loan Amount |
|---|---|---|---|
| Previous Owner | Parker Patrick L | $116,858 |
Source: Public Records
Tax History Compared to Growth
Tax History
| Year | Tax Paid | Tax Assessment Tax Assessment Total Assessment is a certain percentage of the fair market value that is determined by local assessors to be the total taxable value of land and additions on the property. | Land | Improvement |
|---|---|---|---|---|
| 2025 | $1,433 | $80,824 | $30,100 | $50,724 |
| 2024 | $1,392 | $80,824 | $30,100 | $50,724 |
| 2023 | $1,374 | $75,851 | $28,000 | $47,851 |
| 2022 | $1,352 | $67,338 | $23,450 | $43,888 |
| 2021 | $1,312 | $63,342 | $21,700 | $41,642 |
| 2020 | $1,271 | $62,376 | $21,000 | $41,376 |
| 2019 | $1,256 | $59,811 | $18,900 | $40,911 |
| 2018 | $1,198 | $54,000 | $14,700 | $39,300 |
| 2017 | $1,705 | $52,011 | $12,250 | $39,761 |
| 2016 | $1,374 | $50,638 | $10,500 | $40,138 |
| 2015 | $1,367 | $41,472 | $7,350 | $34,122 |
| 2014 | $1,365 | $32,162 | $5,950 | $26,212 |
Source: Public Records
Map
Nearby Homes
- 7849 March Brown Ave
- 7844 Quill Gordon Ave
- 7804 Wind Drift Rd
- 5708 Berwick Falls Ln
- 7837 Mission Point Ln
- 5732 Desert Sky Way
- 5704 Burdel St
- 7721 Beach Falls Ct
- 5600 Bolton Bay Way
- 5721 Whale Rock St
- 5728 Savant Ct
- 6013 Pebble Grey Ln
- 5712 Savant Ct
- 7563 Violet Vista Ave Unit 201
- 7908 Painted Rock Ln
- 7912 Painted Rock Ln
- 5509 Big Sky Ln
- 6105 Crockery St
- 7566 Glowing Ember Ct Unit 101
- 7633 Valley Green Dr Unit 202
- 5840 Drift Boat St
- 5848 Drift Boat St
- 5836 Drift Boat St
- 7820 March Brown Ave
- 7824 March Brown Ave
- 7829 March Brown Ave
- 7812 Blue Charm Ave
- 7808 Blue Charm Ave
- 7816 Blue Charm Ave
- 7828 March Brown Ave Unit 3
- 7833 March Brown Ave
- 7800 Blue Charm Ave
- 7828 Blue Charm Ave
- 7832 March Brown Ave
- 7837 March Brown Ave Unit 3
- 7832 Blue Charm Ave
- 7832 Blue Charm Ave Unit na
- 7836 March Brown Ave
- 7841 March Brown Ave
- 7836 Blue Charm Ave