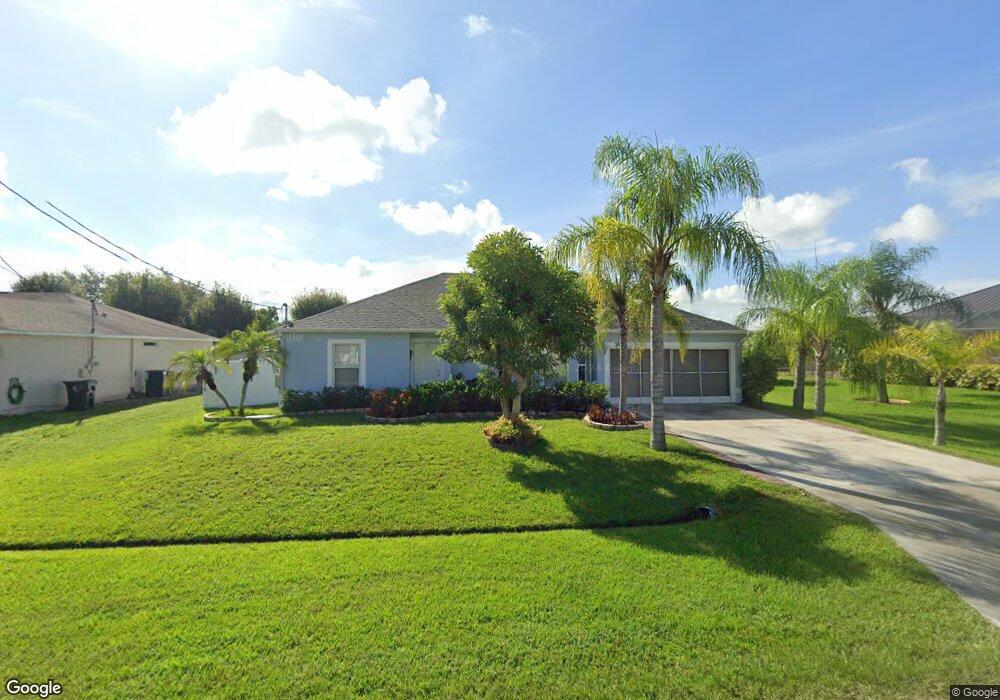
5845 NW Cullom Cir Port Saint Lucie, FL 34986
Torino NeighborhoodEstimated Value: $364,992 - $424,000
3
Beds
2
Baths
1,704
Sq Ft
$230/Sq Ft
Est. Value
About This Home
This home is located at 5845 NW Cullom Cir, Port Saint Lucie, FL 34986 and is currently estimated at $392,748, approximately $230 per square foot. 5845 NW Cullom Cir is a home located in St. Lucie County with nearby schools including West Gate K-8 School, Bayshore Elementary School, and Oak Hammock K-8 School.
Ownership History
Date
Name
Owned For
Owner Type
Purchase Details
Closed on
Jan 7, 2004
Sold by
Gomes Linda G and Zimmerman Marann
Bought by
Solis Eduardo and Solis Maria R
Current Estimated Value
Home Financials for this Owner
Home Financials are based on the most recent Mortgage that was taken out on this home.
Original Mortgage
$100,000
Outstanding Balance
$47,187
Interest Rate
6.03%
Mortgage Type
Purchase Money Mortgage
Estimated Equity
$345,561
Purchase Details
Closed on
Feb 15, 2002
Sold by
Maronda Homes Inc Fl
Bought by
Gomes Linda G and Zimmerman Ann E
Home Financials for this Owner
Home Financials are based on the most recent Mortgage that was taken out on this home.
Original Mortgage
$80,400
Interest Rate
6.81%
Mortgage Type
Purchase Money Mortgage
Purchase Details
Closed on
Jun 6, 2001
Sold by
Roberts Hal J and Roberts Janice
Bought by
Maronda Homes Inc
Purchase Details
Closed on
Oct 23, 2000
Sold by
Talley Carl Perry
Bought by
Roberts Hal and Roberts Janice
Create a Home Valuation Report for This Property
The Home Valuation Report is an in-depth analysis detailing your home's value as well as a comparison with similar homes in the area
Home Values in the Area
Average Home Value in this Area
Purchase History
| Date | Buyer | Sale Price | Title Company |
|---|---|---|---|
| Solis Eduardo | $176,000 | -- | |
| Gomes Linda G | $85,600 | -- | |
| Maronda Homes Inc | $6,900 | -- | |
| Roberts Hal | $6,500 | -- |
Source: Public Records
Mortgage History
| Date | Status | Borrower | Loan Amount |
|---|---|---|---|
| Open | Solis Eduardo | $100,000 | |
| Previous Owner | Gomes Linda G | $80,400 |
Source: Public Records
Tax History Compared to Growth
Tax History
| Year | Tax Paid | Tax Assessment Tax Assessment Total Assessment is a certain percentage of the fair market value that is determined by local assessors to be the total taxable value of land and additions on the property. | Land | Improvement |
|---|---|---|---|---|
| 2024 | $2,398 | $124,049 | -- | -- |
| 2023 | $2,398 | $120,436 | $0 | $0 |
| 2022 | $2,275 | $116,929 | $0 | $0 |
| 2021 | $2,175 | $113,524 | $0 | $0 |
| 2020 | $2,177 | $111,957 | $0 | $0 |
| 2019 | $2,148 | $109,440 | $0 | $0 |
| 2018 | $2,032 | $107,400 | $0 | $0 |
| 2017 | $2,003 | $160,200 | $38,000 | $122,200 |
| 2016 | $1,968 | $146,500 | $28,000 | $118,500 |
| 2015 | $1,983 | $114,100 | $20,800 | $93,300 |
| 2014 | $1,892 | $101,500 | $0 | $0 |
Source: Public Records
Map
Nearby Homes
- 5761 NW Cone St
- 5863 NW Jannebo Ct
- 5867 NW Carovel Ave Unit 77
- 5865 NW Mesa Cir
- 5842 NW Windy Pines Ln
- 5898 NW Joan Ct
- 5540 Kyle Ct
- 5801 NW Dana Cir
- 5810 NW Blue Bonnet Ct
- 5811 NW Blue Bonnet Ct
- 5522 NW Cordrey St
- 5834 NW Windy Pines Ln
- 5543 NW South Lundy Cir
- 5543 S Lundy Cir
- 5501 NW Camberly Ct
- 6443 NW Fir Ct
- 5514 NW West Lundy Cir
- 5928 NW Wesley Rd
- 5814 Gillespie Ave
- 5924 NW Foust Cir
- 5851 NW Cullom Cir
- 5842 NW Gabo Ct
- 5833 NW Cullom Cir
- 5844 NW Cullom Cir
- 5853 NW Cullom Cir
- 5840 NW Gabo Ct
- 5846 NW Cullom Cir
- 5857 NW Cullom Cir
- 5844 NW Gabo Ct
- 5842 NW Cullom Cir
- 5850 NW Cullom Cir
- 5859 NW Cullom Cir
- 5840 NW Cullom Cir
- 5838 NW Cullom Cir
- 5861 NW Cullom Cir
- 5830 NW Cullom Cir
- 5856 NW Cullom Cir
- 5836 NW Cullom Cir
- 5834 NW Cullom Cir
- 5823 NW Cullom Cir