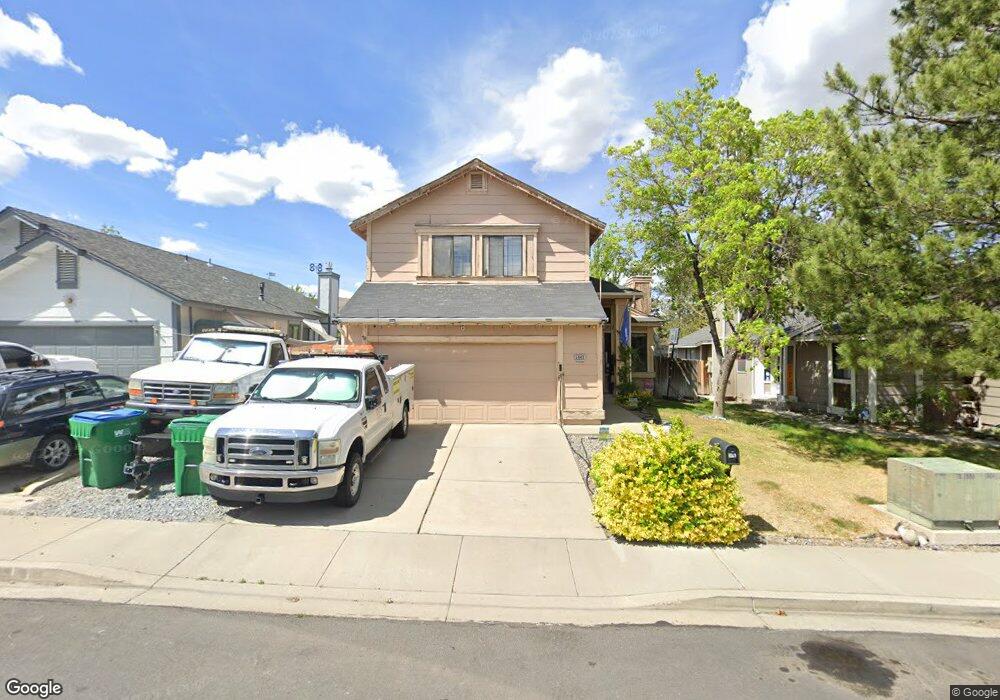
5845 Starcrest Ave Reno, NV 89523
Mae Anne Avenue NeighborhoodEstimated Value: $518,637 - $540,000
3
Beds
3
Baths
1,384
Sq Ft
$382/Sq Ft
Est. Value
About This Home
This home is located at 5845 Starcrest Ave, Reno, NV 89523 and is currently estimated at $529,159, approximately $382 per square foot. 5845 Starcrest Ave is a home located in Washoe County with nearby schools including Sarah Winnemucca Elementary School, B D Billinghurst Middle School, and Robert McQueen High School.
Ownership History
Date
Name
Owned For
Owner Type
Purchase Details
Closed on
Dec 15, 2023
Sold by
Richard P And Dale R Tambellini Living T
Bought by
Tambellini Survivors Trust and Richard P And Dale R Tambellini Living Trust
Current Estimated Value
Purchase Details
Closed on
May 10, 2001
Sold by
Janiga Daniel M and Janiga Jean M
Bought by
Tambellini Richard P and Tambellini Dale R
Purchase Details
Closed on
May 16, 1997
Sold by
Reis James W and Reis Karen I
Bought by
Janiga Daniel M and Janiga Jean M
Home Financials for this Owner
Home Financials are based on the most recent Mortgage that was taken out on this home.
Original Mortgage
$133,200
Interest Rate
8.15%
Purchase Details
Closed on
Nov 23, 1993
Sold by
Reis James W
Bought by
Reis James W and Reis Karen I
Home Financials for this Owner
Home Financials are based on the most recent Mortgage that was taken out on this home.
Original Mortgage
$108,189
Interest Rate
6.85%
Mortgage Type
FHA
Create a Home Valuation Report for This Property
The Home Valuation Report is an in-depth analysis detailing your home's value as well as a comparison with similar homes in the area
Home Values in the Area
Average Home Value in this Area
Purchase History
| Date | Buyer | Sale Price | Title Company |
|---|---|---|---|
| Tambellini Survivors Trust | -- | None Listed On Document | |
| Tambellini Richard P | $160,000 | Stewart Title Northern Nevad | |
| Janiga Daniel M | $148,000 | United Title | |
| Reis James W | -- | First Centennial Title Co |
Source: Public Records
Mortgage History
| Date | Status | Borrower | Loan Amount |
|---|---|---|---|
| Previous Owner | Janiga Daniel M | $133,200 | |
| Previous Owner | Reis James W | $108,189 |
Source: Public Records
Tax History Compared to Growth
Tax History
| Year | Tax Paid | Tax Assessment Tax Assessment Total Assessment is a certain percentage of the fair market value that is determined by local assessors to be the total taxable value of land and additions on the property. | Land | Improvement |
|---|---|---|---|---|
| 2025 | $2,324 | $80,410 | $39,340 | $41,070 |
| 2024 | $2,324 | $77,302 | $35,595 | $41,707 |
| 2023 | $2,153 | $77,328 | $37,520 | $39,808 |
| 2022 | $1,993 | $65,027 | $31,605 | $33,422 |
| 2021 | $1,906 | $55,241 | $21,735 | $33,506 |
| 2020 | $1,791 | $54,691 | $20,895 | $33,796 |
| 2019 | $1,739 | $53,653 | $20,755 | $32,898 |
| 2018 | $1,660 | $47,465 | $15,085 | $32,380 |
| 2017 | $1,594 | $46,675 | $14,070 | $32,605 |
| 2016 | $1,555 | $46,165 | $12,670 | $33,495 |
| 2015 | $392 | $44,715 | $11,095 | $33,620 |
| 2014 | $1,503 | $42,841 | $9,975 | $32,866 |
| 2013 | -- | $39,774 | $7,245 | $32,529 |
Source: Public Records
Map
Nearby Homes
- 1255 Silver Crest Cir
- 6087 White Water Way
- 1500 Backer Way
- 5870 Blue Horizon Dr
- 5830 Blue Horizon Dr
- 1031 Ambassador Dr
- 5895 Blue Horizon Dr
- 6357 Moon Ridge Terrace
- 6339 Park Place
- 6338 Chesterfield Ln
- 1659 Shadow Park Dr
- 5878 Grand Row Way
- 5882 Grand Row Way Unit Lot 61
- 0 Simons Dr
- 1627 Prancer St Unit Lot 50
- 1627 Prancer St
- 1615 Prancer St Unit Lot 53
- 1689 Shadow Park Dr
- Walker Plan at Monarch
- Humboldt Plan at Monarch
- 5839 Starcrest Ave
- 5849 Starcrest Ave
- 5855 Starcrest Ave
- 1115 Backer Way
- 1095 Backer Way
- 5865 Starcrest Ave
- 5848 Starcrest Ave
- 5848 Starcrest Ave Unit 270
- 5848 Starcrest Ave
- 5840 Starcrest Ave Unit 2
- 5850 Starcrest Ave
- 5875 Starcrest Ave
- 5836 Starcrest Ave
- 5860 Starcrest Ave
- 1065 Backer Way
- 5870 Starcrest Ave
- 5885 Starcrest Ave
- 1055 Backer Way
- 1100 Backer Way
- 5880 Starcrest Ave