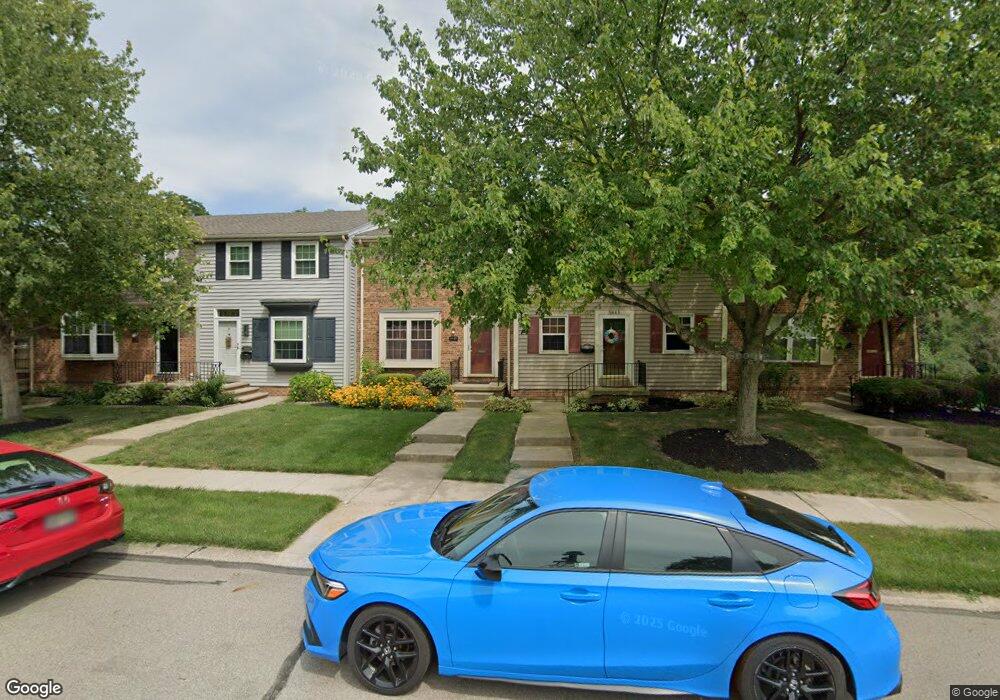
5847 Overbrooke Rd Unit 5847 Dayton, OH 45440
Estimated Value: $159,000 - $176,000
2
Beds
2
Baths
1,080
Sq Ft
$155/Sq Ft
Est. Value
About This Home
This home is located at 5847 Overbrooke Rd Unit 5847, Dayton, OH 45440 and is currently estimated at $167,298, approximately $154 per square foot. 5847 Overbrooke Rd Unit 5847 is a home located in Montgomery County with nearby schools including Primary Village North, Driscoll Elementary School, and Hadley E Watts Middle School.
Ownership History
Date
Name
Owned For
Owner Type
Purchase Details
Closed on
Jul 18, 2007
Sold by
Va
Bought by
Finster Matthew T
Current Estimated Value
Home Financials for this Owner
Home Financials are based on the most recent Mortgage that was taken out on this home.
Original Mortgage
$80,122
Outstanding Balance
$50,574
Interest Rate
6.69%
Mortgage Type
FHA
Estimated Equity
$116,724
Purchase Details
Closed on
Jul 11, 2006
Sold by
Dill Phillip A and Mortgage Electronic Registrati
Bought by
Va
Purchase Details
Closed on
Sep 30, 2002
Sold by
Sellers Shawn M
Bought by
Dill Phillip A
Home Financials for this Owner
Home Financials are based on the most recent Mortgage that was taken out on this home.
Original Mortgage
$84,660
Interest Rate
6.39%
Mortgage Type
VA
Purchase Details
Closed on
Nov 28, 1997
Sold by
Anglin Deborah F
Bought by
Sellers Shawn M
Create a Home Valuation Report for This Property
The Home Valuation Report is an in-depth analysis detailing your home's value as well as a comparison with similar homes in the area
Home Values in the Area
Average Home Value in this Area
Purchase History
| Date | Buyer | Sale Price | Title Company |
|---|---|---|---|
| Finster Matthew T | -- | None Available | |
| Va | $78,436 | None Available | |
| Dill Phillip A | $83,000 | -- | |
| Sellers Shawn M | $70,000 | -- |
Source: Public Records
Mortgage History
| Date | Status | Borrower | Loan Amount |
|---|---|---|---|
| Open | Finster Matthew T | $80,122 | |
| Previous Owner | Dill Phillip A | $84,660 |
Source: Public Records
Tax History Compared to Growth
Tax History
| Year | Tax Paid | Tax Assessment Tax Assessment Total Assessment is a certain percentage of the fair market value that is determined by local assessors to be the total taxable value of land and additions on the property. | Land | Improvement |
|---|---|---|---|---|
| 2024 | $2,857 | $49,020 | $10,150 | $38,870 |
| 2023 | $2,857 | $49,020 | $10,150 | $38,870 |
| 2022 | $2,487 | $33,810 | $7,000 | $26,810 |
| 2021 | $2,494 | $33,810 | $7,000 | $26,810 |
| 2020 | $2,477 | $33,620 | $7,000 | $26,620 |
| 2019 | $2,303 | $27,880 | $7,000 | $20,880 |
| 2018 | $2,042 | $27,880 | $7,000 | $20,880 |
| 2017 | $2,019 | $27,880 | $7,000 | $20,880 |
| 2016 | $1,943 | $25,320 | $7,000 | $18,320 |
| 2015 | $1,924 | $25,320 | $7,000 | $18,320 |
| 2014 | $1,924 | $25,320 | $7,000 | $18,320 |
| 2012 | -- | $27,010 | $7,000 | $20,010 |
Source: Public Records
Map
Nearby Homes
- 5804 Overbrooke Rd
- 5891 Overbrooke Rd Unit 5891
- 5310 Glenmina Dr
- 2925 Walford Dr
- 5324 Oakbrooke Dr
- 2278 Millwood Rd
- 1820 Piper Ln Unit 103
- 5274 Millcreek Rd
- 5052 Dobbs Dr
- 1770 Piper Ln Unit 208
- 2225 Coach Dr Unit F
- 2225 Coach Dr Unit L
- 5685 Coach Dr E Unit D
- 5660 Coach Dr W Unit C
- 1740 Piper Ln
- 2236 E Whipp Rd
- 5710 Coach Dr W Unit E
- 2579 Walford Dr
- 6350 Gwinnett Ln Unit 1326
- 1002 Belfast Dr
- 5851 Overbrooke Rd Unit 5851
- 5849 Overbrooke Rd Unit 5849
- 5853 Overbrooke Rd Unit 5835
- 5845 Overbrooke Rd Unit 5845
- 5843 Overbrooke Rd Unit 5843
- 5841 Overbrooke Rd Unit 5841
- 5855 Overbrooke Rd Unit 5855
- 5857 Overbrooke Rd Unit 5857
- 5859 Overbrooke Rd Unit 5859
- 5861 Overbrooke Rd Unit 5861
- 5884 Overbrooke Rd
- 5833 Overbrooke Rd Unit 5833
- 5865 Overbrooke Rd Unit 5865
- 5839 Overbrooke Rd Unit 5839
- 5874 Overbrooke Rd
- 5837 Overbrooke Rd Unit 5837
- 5863 Overbrooke Rd Unit 5863
- 5831 Overbrooke Rd Unit 5831
- 5894 Overbrooke Rd
- 5864 Overbrooke Rd