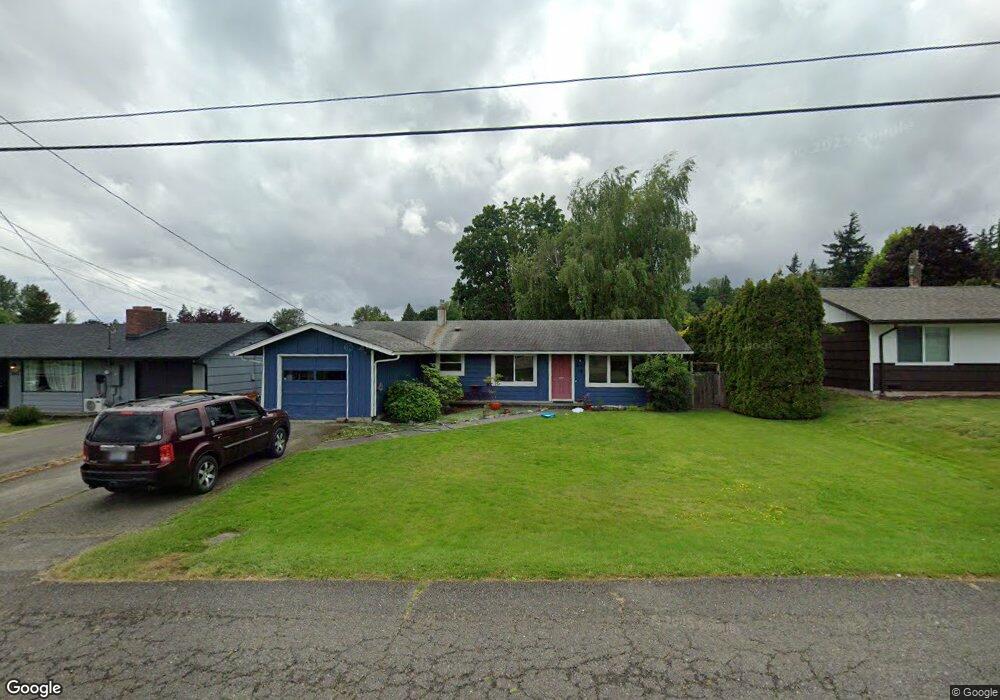
5847 Seamount Dr Ferndale, WA 98248
Estimated Value: $477,000 - $517,000
3
Beds
2
Baths
1,300
Sq Ft
$380/Sq Ft
Est. Value
About This Home
This home is located at 5847 Seamount Dr, Ferndale, WA 98248 and is currently estimated at $493,846, approximately $379 per square foot. 5847 Seamount Dr is a home located in Whatcom County with nearby schools including Skyline Elementary School, Vista Middle School, and Ferndale High School.
Ownership History
Date
Name
Owned For
Owner Type
Purchase Details
Closed on
Dec 18, 2023
Sold by
Bader Jeremy A and Bader April K
Bought by
Jeremy And April Bader Living Trust and Bader
Current Estimated Value
Purchase Details
Closed on
Jun 30, 2008
Sold by
Sanchez Edward and Sanchez Jennifer
Bought by
Bader Jeremy A and Bader April K
Home Financials for this Owner
Home Financials are based on the most recent Mortgage that was taken out on this home.
Original Mortgage
$219,700
Interest Rate
6.04%
Mortgage Type
Purchase Money Mortgage
Purchase Details
Closed on
Aug 24, 2005
Sold by
Chen Samuel G and Chen Regan J
Bought by
Sanchez Edward and Sanchez Jennifer
Home Financials for this Owner
Home Financials are based on the most recent Mortgage that was taken out on this home.
Original Mortgage
$192,951
Interest Rate
5.76%
Mortgage Type
FHA
Create a Home Valuation Report for This Property
The Home Valuation Report is an in-depth analysis detailing your home's value as well as a comparison with similar homes in the area
Home Values in the Area
Average Home Value in this Area
Purchase History
| Date | Buyer | Sale Price | Title Company |
|---|---|---|---|
| Jeremy And April Bader Living Trust | $313 | None Listed On Document | |
| Bader Jeremy A | $226,780 | First American Title Ins | |
| Sanchez Edward | $196,280 | Chicago Title Insurance |
Source: Public Records
Mortgage History
| Date | Status | Borrower | Loan Amount |
|---|---|---|---|
| Previous Owner | Bader Jeremy A | $219,700 | |
| Previous Owner | Sanchez Edward | $192,951 |
Source: Public Records
Tax History Compared to Growth
Tax History
| Year | Tax Paid | Tax Assessment Tax Assessment Total Assessment is a certain percentage of the fair market value that is determined by local assessors to be the total taxable value of land and additions on the property. | Land | Improvement |
|---|---|---|---|---|
| 2024 | $3,139 | $452,808 | $224,070 | $228,738 |
| 2023 | $3,139 | $450,940 | $231,000 | $219,940 |
| 2022 | $2,583 | $349,062 | $149,808 | $199,254 |
| 2021 | $2,601 | $288,480 | $123,808 | $164,672 |
| 2020 | $2,518 | $267,118 | $114,640 | $152,478 |
| 2019 | $1,937 | $232,652 | $99,848 | $132,804 |
| 2018 | $2,259 | $212,707 | $91,288 | $121,419 |
| 2017 | $1,951 | $186,405 | $80,000 | $106,405 |
| 2016 | $1,832 | $174,150 | $68,349 | $105,801 |
| 2015 | $1,836 | $164,001 | $64,709 | $99,292 |
| 2014 | -- | $160,587 | $63,240 | $97,347 |
| 2013 | -- | $158,288 | $62,000 | $96,288 |
Source: Public Records
Map
Nearby Homes
- 5948 Shannon Ave
- 5910 Artist Dr
- 2406 Heights Dr
- 2396 Hettervig Place
- 2136 Hawthorne St
- 2234 Main St
- 5829 Vista Dr
- 5780 Church Rd
- 2344 Main St
- 6008 S Bakerview Park Dr
- 2333 Main St
- 5861 Malloy Ave
- 5686 Sunstone Place Unit 101
- 2503 Lakeridge Dr
- 5682 Sunstone Place Unit 103
- 6002 Ridgeview Place
- 6047 Sunshine Dr
- 2273 Douglas Rd
- 5685 Correll Dr
- 5675 Rosemary Ave
- 5853 Seamount Dr
- 5870 Sherry Place
- 5859 Seamount Dr
- 5837 Seamount Dr
- 5868 Sherry Place
- 5872 Sherry Place
- 24 Crestline St
- 5848 Seamount Dr
- 5854 Seamount Dr
- 5844 Seamount Dr
- 5866 Sherry Place
- 5863 Seamount Dr
- 5833 Seamount Dr
- 2282 Hawthorne St
- 5860 Seamount Dr
- 5874 Sherry Place
- 5864 Sherry Place
- 5847 Madrona Dr
- 2278 Hawthorne St
- 5864 Seamount Dr