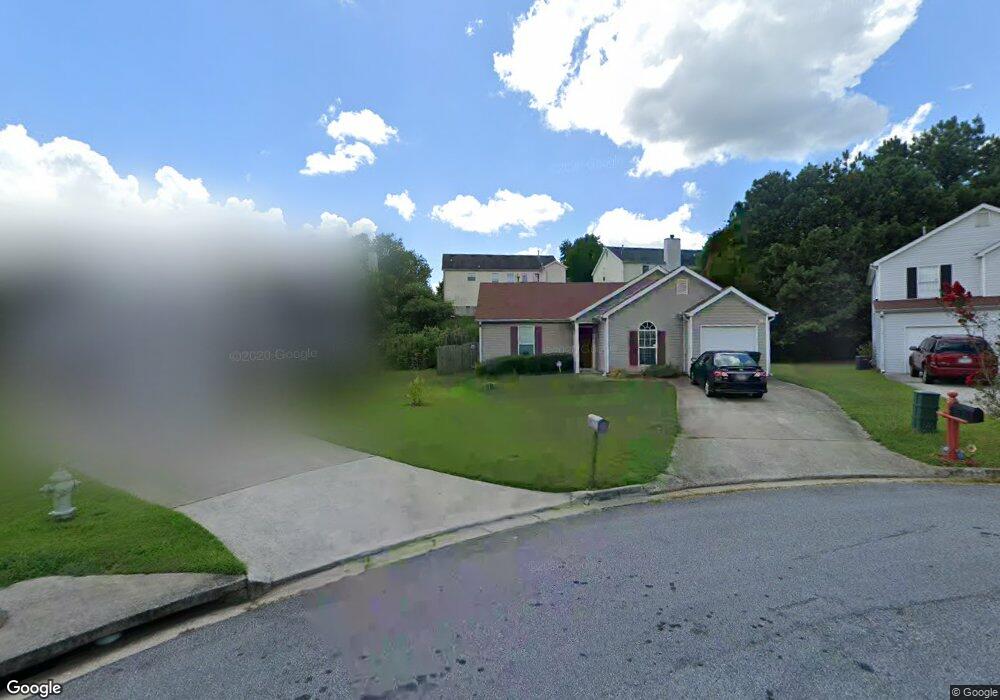
5849 Eagles Watch Ct Unit 2 Riverdale, GA 30274
Estimated Value: $217,690 - $239,000
3
Beds
2
Baths
1,366
Sq Ft
$167/Sq Ft
Est. Value
About This Home
This home is located at 5849 Eagles Watch Ct Unit 2, Riverdale, GA 30274 and is currently estimated at $227,923, approximately $166 per square foot. 5849 Eagles Watch Ct Unit 2 is a home located in Clayton County with nearby schools including Riverdale Elementary School, Sequoyah Middle School, and Charles R. Drew High School.
Ownership History
Date
Name
Owned For
Owner Type
Purchase Details
Closed on
Feb 7, 2020
Sold by
Mitchell Krystle
Bought by
Mitchell Krystle and Randolph Deborah A
Current Estimated Value
Purchase Details
Closed on
Sep 5, 2006
Sold by
Reo Management 2002 Inc
Bought by
Randolph Krystle
Home Financials for this Owner
Home Financials are based on the most recent Mortgage that was taken out on this home.
Original Mortgage
$90,320
Interest Rate
6.36%
Mortgage Type
New Conventional
Purchase Details
Closed on
Feb 7, 2006
Sold by
Hurley-Carr Tamika
Bought by
Reo Management 2002 Inc
Purchase Details
Closed on
Apr 28, 2000
Sold by
Gt Architecture Contractors Corp
Bought by
Carr Tamika H
Home Financials for this Owner
Home Financials are based on the most recent Mortgage that was taken out on this home.
Original Mortgage
$93,482
Interest Rate
8.28%
Mortgage Type
FHA
Create a Home Valuation Report for This Property
The Home Valuation Report is an in-depth analysis detailing your home's value as well as a comparison with similar homes in the area
Home Values in the Area
Average Home Value in this Area
Purchase History
| Date | Buyer | Sale Price | Title Company |
|---|---|---|---|
| Mitchell Krystle | -- | -- | |
| Randolph Krystle | $112,900 | -- | |
| Reo Management 2002 Inc | $99,450 | -- | |
| Carr Tamika H | $94,000 | -- |
Source: Public Records
Mortgage History
| Date | Status | Borrower | Loan Amount |
|---|---|---|---|
| Previous Owner | Randolph Krystle | $90,320 | |
| Previous Owner | Carr Tamika H | $93,482 |
Source: Public Records
Tax History
| Year | Tax Paid | Tax Assessment Tax Assessment Total Assessment is a certain percentage of the fair market value that is determined by local assessors to be the total taxable value of land and additions on the property. | Land | Improvement |
|---|---|---|---|---|
| 2025 | $1,640 | $99,680 | $8,000 | $91,680 |
| 2024 | $1,613 | $95,160 | $8,000 | $87,160 |
| 2023 | $3,343 | $92,600 | $8,000 | $84,600 |
| 2022 | $1,073 | $67,800 | $8,000 | $59,800 |
| 2021 | $787 | $52,440 | $8,000 | $44,440 |
| 2020 | $1,848 | $45,251 | $8,000 | $37,251 |
| 2019 | $1,752 | $42,223 | $6,400 | $35,823 |
| 2018 | $1,599 | $38,463 | $6,400 | $32,063 |
| 2017 | $1,237 | $29,461 | $6,400 | $23,061 |
| 2016 | $710 | $26,526 | $6,400 | $20,126 |
| 2015 | $708 | $0 | $0 | $0 |
| 2014 | $762 | $18,207 | $6,400 | $11,807 |
Source: Public Records
Map
Nearby Homes
- 425 Eagles Flight Ln
- 5899 Eagles Feather Ln
- 5855 Eagles Crossing Ln
- 6501 River Run Rd Unit 3
- 746 Boston Common
- 807 Boston Common
- 811 Boston Common
- 545 Oak Valley Dr
- 843 Garden Walk Blvd
- 503 Roy Huie Rd
- 6286 Highway 85
- 834 Pine Shoals Ct
- 216 Scarsdale Dr
- 610 Roy Huie Rd
- 742 Verde Dr
- 172 Scarsdale Dr
- 939 Silverwood Dr
- 370 Valiant Ln
- 149 Roy Huie Rd
- 6371 Westbury Rd
- 5848 Eagles Watch Ct Unit 2
- 413 Eagles Flight Ln Unit 2
- 5845 Eagles Watch Ct
- 419 Eagles Flight Ln Unit 2
- 407 Eagles Flight Ln Unit 2
- 5841 Eagles Watch Ct Unit 2
- 5844 Eagles Watch Ct Unit 2
- 401 Eagles Flight Ln Unit 3
- 404 Eagles Crossing Cir Unit 2
- 5840 Eagles Watch Ct
- 410 Eagles Crossing Cir
- 431 Eagles Flight Ln Unit 2
- 392 Eagles Crossing Cir Unit 2
- 395 Eagles Flight Ln Unit 3
- 5846 Eagles Feather Ln
- 5852 Eagles Feather Ln
- 374 Eaglets Ct
- 5840 Eagles Feather Ln
- 386 Eagles Crossing Cir Unit 2
- 410 Eagles Flight Ln
Your Personal Tour Guide
Ask me questions while you tour the home.