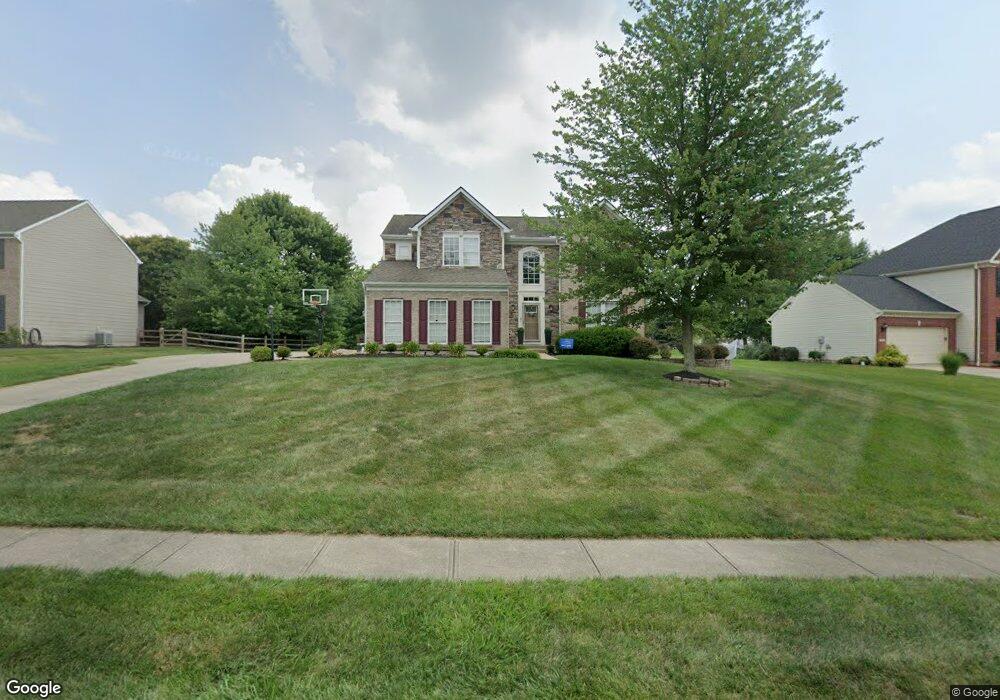
5849 Irish Dude Dr Loveland, OH 45140
Outer Loveland NeighborhoodEstimated Value: $482,000 - $607,000
4
Beds
3
Baths
2,614
Sq Ft
$207/Sq Ft
Est. Value
About This Home
This home is located at 5849 Irish Dude Dr, Loveland, OH 45140 and is currently estimated at $541,290, approximately $207 per square foot. 5849 Irish Dude Dr is a home located in Clermont County with nearby schools including Milford Senior High School, Milford Christian Academy, and St. Andrew - St. Elizabeth Ann Seton School.
Ownership History
Date
Name
Owned For
Owner Type
Purchase Details
Closed on
Dec 5, 2017
Sold by
Brock Tony A and Brock Kelly F
Bought by
Mccommons Djantae and Mccommons Katelyn M
Current Estimated Value
Home Financials for this Owner
Home Financials are based on the most recent Mortgage that was taken out on this home.
Original Mortgage
$281,700
Outstanding Balance
$236,921
Interest Rate
3.9%
Mortgage Type
New Conventional
Estimated Equity
$304,369
Purchase Details
Closed on
Jan 15, 2003
Sold by
Stamper Adrian B
Bought by
Stamper Debbie J
Purchase Details
Closed on
Mar 16, 2001
Sold by
Nvr Inc
Bought by
Stamper Adrian B and Stamper Debbie J
Home Financials for this Owner
Home Financials are based on the most recent Mortgage that was taken out on this home.
Original Mortgage
$170,308
Interest Rate
7.13%
Mortgage Type
New Conventional
Purchase Details
Closed on
Dec 5, 2000
Sold by
Bramblewood Dev Inc
Bought by
Nvr Inc
Create a Home Valuation Report for This Property
The Home Valuation Report is an in-depth analysis detailing your home's value as well as a comparison with similar homes in the area
Home Values in the Area
Average Home Value in this Area
Purchase History
| Date | Buyer | Sale Price | Title Company |
|---|---|---|---|
| Mccommons Djantae | $313,000 | -- | |
| Stamper Debbie J | -- | -- | |
| Stamper Adrian B | $212,885 | -- | |
| Nvr Inc | $39,000 | -- |
Source: Public Records
Mortgage History
| Date | Status | Borrower | Loan Amount |
|---|---|---|---|
| Open | Mccommons Djantae | $281,700 | |
| Previous Owner | Stamper Adrian B | $170,308 |
Source: Public Records
Tax History Compared to Growth
Tax History
| Year | Tax Paid | Tax Assessment Tax Assessment Total Assessment is a certain percentage of the fair market value that is determined by local assessors to be the total taxable value of land and additions on the property. | Land | Improvement |
|---|---|---|---|---|
| 2024 | $5,798 | $124,850 | $26,600 | $98,250 |
| 2023 | $5,857 | $124,850 | $26,600 | $98,250 |
| 2022 | $5,718 | $92,760 | $19,780 | $72,980 |
| 2021 | $5,724 | $92,760 | $19,780 | $72,980 |
| 2020 | $5,491 | $92,760 | $19,780 | $72,980 |
| 2019 | $6,081 | $97,720 | $19,670 | $78,050 |
| 2018 | $6,073 | $97,720 | $19,670 | $78,050 |
| 2017 | $5,966 | $97,720 | $19,670 | $78,050 |
| 2016 | $5,697 | $83,510 | $16,800 | $66,710 |
| 2015 | $5,469 | $83,510 | $16,800 | $66,710 |
| 2014 | $5,235 | $83,510 | $16,800 | $66,710 |
| 2013 | $4,654 | $72,000 | $17,500 | $54,500 |
Source: Public Records
Map
Nearby Homes
- 5933 Firm Stance Dr
- 1140 Weber Rd
- 2013 Weber Rd
- 6379 Derbyshire Ln
- 1803 Wheatfield Way
- 1513 Charleston Ln
- 1064 Weber Rd
- 6141 Brandywine Ct
- 6149 Century Farm Dr
- 1124 Clover Field Dr
- 6211 Spires Dr
- 1113 Clover Field Dr
- 6661 Paxton Guinea Rd
- 6211 Cook Rd
- 6365 Ironwood Dr
- 6108 Donna Jay Dr
- 6320 Ashford Dr
- 6647 Saddleback Way
- 6650 Saddleback Way
- 6651 Saddleback Way
- 5847 Irish Dude Dr
- 5851 Irish Dude Dr
- 5853 Irish Dude Dr
- 5858 Irish Dude Dr
- 5950 Firm Stance Dr
- 5845 Irish Dude Dr
- 5856 Irish Dude Dr
- 5857 Irish Dude Dr
- 5860 Irish Dude Dr
- 5854 Irish Dude Dr
- 5948 Firm Stance Dr
- 5843 Irish Dude Dr
- 5852 Irish Dude Dr
- 5949 Firm Stance Dr
- 5855 Irish Dude Dr
- 5862 Irish Dude Dr
- 5850 Irish Dude Dr
- 5841 Irish Dude Dr
- 5946 Firm Stance Dr
- 5947 Firm Stance Dr