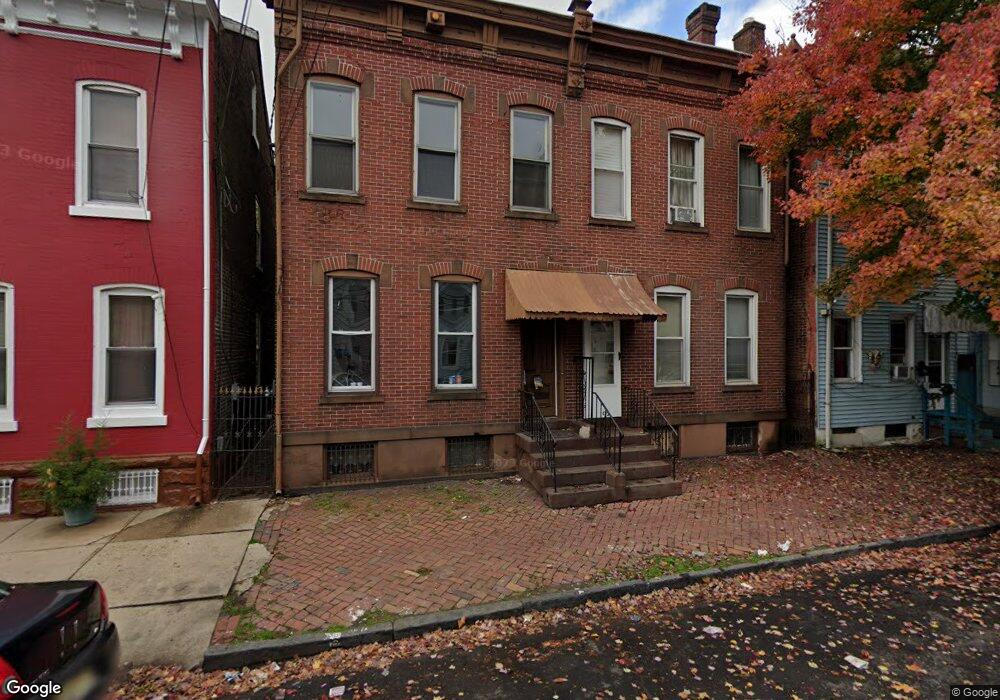
585 Centre St Trenton, NJ 08611
South Trenton NeighborhoodEstimated Value: $184,000 - $263,000
--
Bed
--
Bath
1,712
Sq Ft
$124/Sq Ft
Est. Value
About This Home
This home is located at 585 Centre St, Trenton, NJ 08611 and is currently estimated at $212,052, approximately $123 per square foot. 585 Centre St is a home located in Mercer County with nearby schools including Parker Elementary School, Grace A Dunn Middle School, and Trenton Central High School - Main Campus.
Ownership History
Date
Name
Owned For
Owner Type
Purchase Details
Closed on
Jan 4, 2012
Sold by
Gonzalez Bernardo and Rivera Leslie
Bought by
Jnh Funding Corp
Current Estimated Value
Purchase Details
Closed on
Apr 25, 2007
Sold by
Olivera Angelina
Bought by
Gonzalez Bernardo and Rivera Leslie
Home Financials for this Owner
Home Financials are based on the most recent Mortgage that was taken out on this home.
Original Mortgage
$66,300
Interest Rate
6.18%
Create a Home Valuation Report for This Property
The Home Valuation Report is an in-depth analysis detailing your home's value as well as a comparison with similar homes in the area
Home Values in the Area
Average Home Value in this Area
Purchase History
| Date | Buyer | Sale Price | Title Company |
|---|---|---|---|
| Jnh Funding Corp | $115 | None Available | |
| Gonzalez Bernardo | $78,000 | -- |
Source: Public Records
Mortgage History
| Date | Status | Borrower | Loan Amount |
|---|---|---|---|
| Previous Owner | Gonzalez Bernardo | $66,300 |
Source: Public Records
Tax History Compared to Growth
Tax History
| Year | Tax Paid | Tax Assessment Tax Assessment Total Assessment is a certain percentage of the fair market value that is determined by local assessors to be the total taxable value of land and additions on the property. | Land | Improvement |
|---|---|---|---|---|
| 2025 | $3,858 | $66,500 | $7,800 | $58,700 |
| 2024 | $3,702 | $66,500 | $7,800 | $58,700 |
| 2023 | $3,702 | $66,500 | $7,800 | $58,700 |
| 2022 | $3,630 | $66,500 | $7,800 | $58,700 |
| 2021 | $3,693 | $66,500 | $7,800 | $58,700 |
| 2020 | $3,681 | $66,500 | $7,800 | $58,700 |
| 2019 | $3,622 | $66,500 | $7,800 | $58,700 |
| 2018 | $3,467 | $66,500 | $7,800 | $58,700 |
| 2017 | $3,295 | $66,500 | $7,800 | $58,700 |
| 2016 | $4,182 | $72,700 | $13,200 | $59,500 |
| 2015 | $4,168 | $72,700 | $13,200 | $59,500 |
| 2014 | $4,148 | $72,700 | $13,200 | $59,500 |
Source: Public Records
Map
Nearby Homes