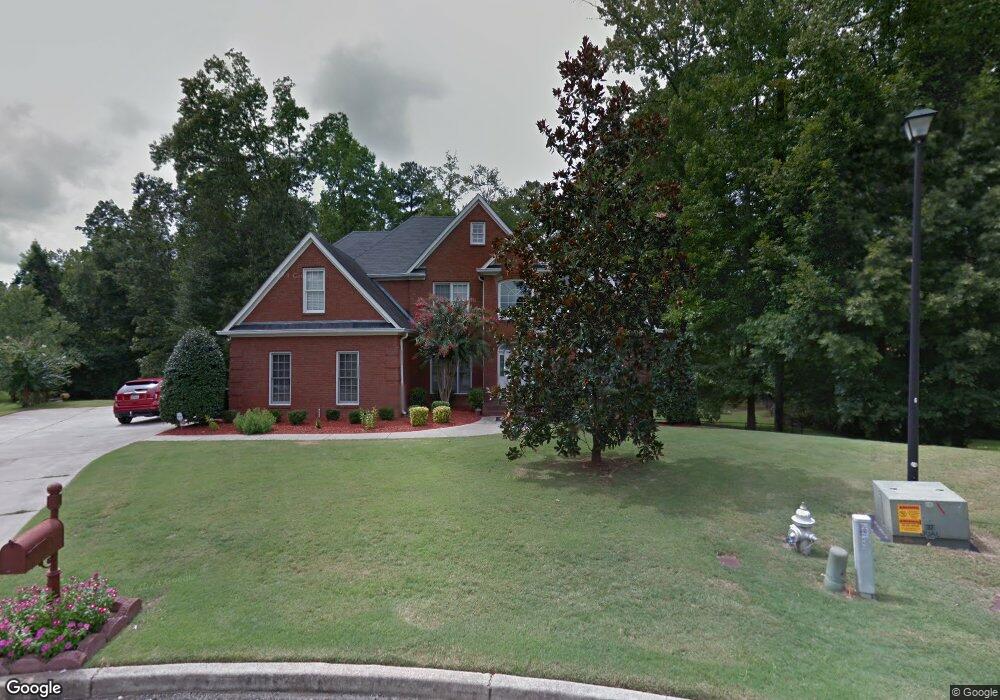
585 Fielding Ct Fayetteville, GA 30215
Estimated Value: $372,000 - $392,663
5
Beds
4
Baths
4,444
Sq Ft
$86/Sq Ft
Est. Value
About This Home
This home is located at 585 Fielding Ct, Fayetteville, GA 30215 and is currently estimated at $382,332, approximately $86 per square foot. 585 Fielding Ct is a home located in Clayton County with nearby schools including River's Edge Elementary School, Eddie White Academy, and Lovejoy High School.
Ownership History
Date
Name
Owned For
Owner Type
Purchase Details
Closed on
Jul 22, 2020
Sold by
Spruill Stella L
Bought by
Church Blanche M
Current Estimated Value
Home Financials for this Owner
Home Financials are based on the most recent Mortgage that was taken out on this home.
Original Mortgage
$257,254
Outstanding Balance
$228,116
Interest Rate
3.1%
Mortgage Type
New Conventional
Estimated Equity
$154,216
Purchase Details
Closed on
Jul 24, 2017
Sold by
Carpenter Ruby M
Bought by
Carpenter Ruby M and Spruill Stella L
Purchase Details
Closed on
Mar 25, 2004
Sold by
Gilmore Jeffrey G and Gilmore Jamie W
Bought by
Carpenter Ruby M
Home Financials for this Owner
Home Financials are based on the most recent Mortgage that was taken out on this home.
Original Mortgage
$200,000
Interest Rate
4.88%
Mortgage Type
New Conventional
Create a Home Valuation Report for This Property
The Home Valuation Report is an in-depth analysis detailing your home's value as well as a comparison with similar homes in the area
Home Values in the Area
Average Home Value in this Area
Purchase History
| Date | Buyer | Sale Price | Title Company |
|---|---|---|---|
| Church Blanche M | $262,000 | -- | |
| Carpenter Ruby M | -- | -- | |
| Carpenter Ruby M | $250,000 | -- | |
| Carpenter Ruby M | $250,000 | -- |
Source: Public Records
Mortgage History
| Date | Status | Borrower | Loan Amount |
|---|---|---|---|
| Open | Church Blanche M | $257,254 | |
| Previous Owner | Carpenter Ruby M | $200,000 | |
| Previous Owner | Carpenter Ruby M | $37,500 |
Source: Public Records
Tax History Compared to Growth
Tax History
| Year | Tax Paid | Tax Assessment Tax Assessment Total Assessment is a certain percentage of the fair market value that is determined by local assessors to be the total taxable value of land and additions on the property. | Land | Improvement |
|---|---|---|---|---|
| 2024 | $6,114 | $166,720 | $8,336 | $158,384 |
| 2023 | $6,020 | $166,720 | $8,336 | $158,384 |
| 2022 | $2,725 | $151,600 | $8,800 | $142,800 |
| 2021 | $4,567 | $115,640 | $8,800 | $106,840 |
| 2020 | $2,106 | $115,348 | $8,800 | $106,548 |
| 2019 | $1,982 | $106,238 | $8,000 | $98,238 |
| 2018 | $1,760 | $95,476 | $8,000 | $87,476 |
| 2017 | $1,549 | $81,732 | $8,000 | $73,732 |
| 2016 | $1,467 | $77,951 | $8,000 | $69,951 |
| 2015 | $1,274 | $0 | $0 | $0 |
| 2014 | $878 | $54,195 | $8,000 | $46,195 |
Source: Public Records
Map
Nearby Homes
- 12245 Molly Sue Ln
- 12274 Molly Sue Ln
- 12203 Crestwood Ct
- 12264 Crestwood Ct
- 12237 Cypress Ln
- 196 Olmstead Ct Unit III
- 183 Inman Rd
- 76 Championship Ct Unit 1
- 134 Carolinas Way
- 12241 Cypress Way
- 12238 Cypress Way
- 281 Tufts Ct
- 244 Sawgrass Way Unit 1
- 11977 Plantation Pkwy
- 274 Sawgrass Way
- 12189 Lauren Way
- 340 Antebellum Way
- 148 Sawgrass Way
- 316 Players Cir Unit 1
- 12022 Harbour Town Pkwy
- 581 Fielding Ct
- 580 Fielding Ct Unit 1
- 574 Fielding Ct Unit 1
- 571 Fielding Ct
- 566 Fielding Ct
- 563 Fielding Ct
- 0 Fielding Ct Unit 7395059
- 0 Fielding Ct Unit 7219736
- 0 Fielding Ct Unit 3281528
- 0 Fielding Ct Unit 3178643
- 0 Fielding Ct Unit 8848336
- 0 Fielding Ct Unit 8418068
- 0 Fielding Ct Unit 8255997
- 0 Fielding Ct Unit 7566064
- 0 Fielding Ct Unit 7542903
- 0 Fielding Ct Unit 7108741
- 0 Fielding Ct Unit 8279056
- 0 Fielding Ct
- 558 Fielding Ct
- 110 Inman Rd