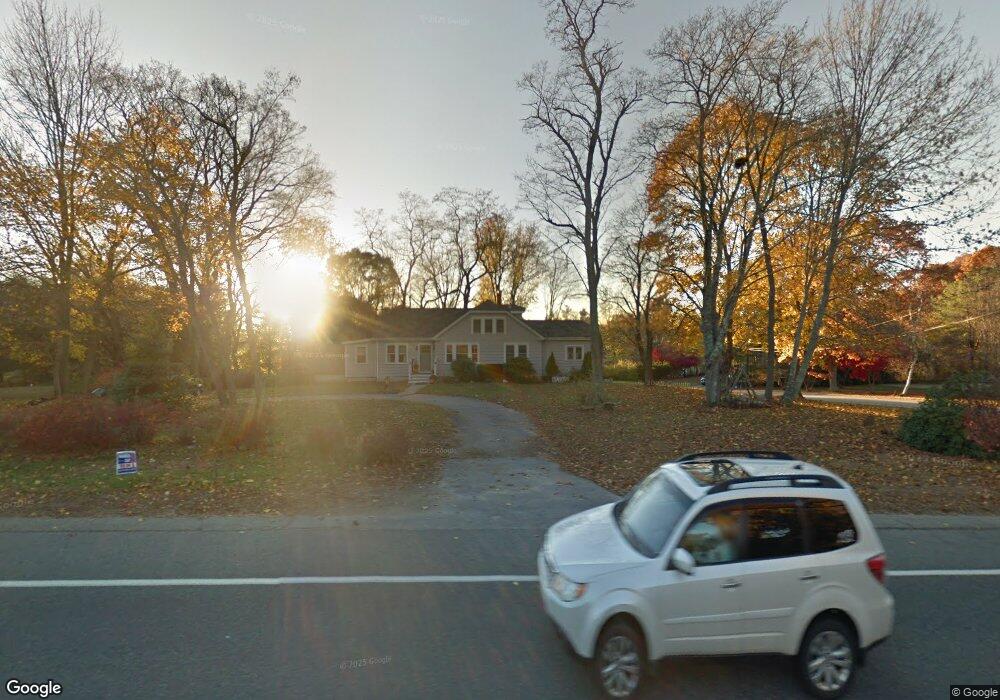
585 Indian Head St Hanson, MA 02341
Estimated Value: $624,218 - $704,000
5
Beds
3
Baths
2,900
Sq Ft
$228/Sq Ft
Est. Value
About This Home
This home is located at 585 Indian Head St, Hanson, MA 02341 and is currently estimated at $661,055, approximately $227 per square foot. 585 Indian Head St is a home located in Plymouth County.
Ownership History
Date
Name
Owned For
Owner Type
Purchase Details
Closed on
Jul 24, 1998
Sold by
Robinson Philip J and Robinson Kristin L
Bought by
Pilote Julia A and Morrison Shane T
Current Estimated Value
Home Financials for this Owner
Home Financials are based on the most recent Mortgage that was taken out on this home.
Original Mortgage
$149,150
Interest Rate
6.99%
Mortgage Type
Purchase Money Mortgage
Create a Home Valuation Report for This Property
The Home Valuation Report is an in-depth analysis detailing your home's value as well as a comparison with similar homes in the area
Home Values in the Area
Average Home Value in this Area
Purchase History
| Date | Buyer | Sale Price | Title Company |
|---|---|---|---|
| Pilote Julia A | $157,000 | -- |
Source: Public Records
Mortgage History
| Date | Status | Borrower | Loan Amount |
|---|---|---|---|
| Open | Pilote Julia A | $292,000 | |
| Closed | Pilote Julia A | $260,000 | |
| Closed | Pilote Julia A | $208,000 | |
| Closed | Pilote Julia A | $149,150 |
Source: Public Records
Tax History Compared to Growth
Tax History
| Year | Tax Paid | Tax Assessment Tax Assessment Total Assessment is a certain percentage of the fair market value that is determined by local assessors to be the total taxable value of land and additions on the property. | Land | Improvement |
|---|---|---|---|---|
| 2025 | $6,509 | $486,500 | $163,600 | $322,900 |
| 2024 | $6,323 | $472,600 | $158,900 | $313,700 |
| 2023 | $6,129 | $432,200 | $158,900 | $273,300 |
| 2022 | $5,932 | $393,100 | $144,400 | $248,700 |
| 2021 | $4,210 | $278,800 | $138,900 | $139,900 |
| 2020 | $4,108 | $269,000 | $141,600 | $127,400 |
| 2019 | $4,002 | $257,700 | $138,900 | $118,800 |
| 2018 | $3,965 | $250,500 | $133,500 | $117,000 |
| 2017 | $3,856 | $241,300 | $127,200 | $114,100 |
| 2016 | $3,952 | $238,800 | $127,200 | $111,600 |
| 2015 | $3,773 | $237,000 | $127,200 | $109,800 |
Source: Public Records
Map
Nearby Homes
- 109 Richard Rd
- Lot 6 Way
- Lot 2 Harvard Rd
- 52 Richard Rd
- 438 Maquan St
- 145 Gorwin Dr
- 29 Bayberry Rd
- 161 Winter St Unit 24
- 125 Independence Ave
- 269 Lakeside Rd
- 166 Pine Grove Ave
- 42 Taylor Point Rd
- 456 Gorwin Dr
- 479 Main St
- 26 Stonebridge Dr
- 38 Stonebridge Dr Unit 38
- 20 Carol Ave
- 1054 Main St
- 80 Phillips St
- 72 Phillips St
- 571 Indian Head St
- 594 Indian Head St
- 607 Indian Head St
- 576 Indian Head St
- 26 Indian Trail
- 43 Indian Trail
- 40 Indian Trail
- 617 Indian Head St
- 41 Ransom Rd
- 41 Ransom Rd
- 612 Indian Head St
- 552 Indian Head St
- 56 Indian Path
- 631 Indian Head St
- 57 Indian Trail
- 531 Indian Head St
- 636 Indian Head St
- 61 Ransom Rd
- 48 Indian Path
- 67 Indian Trail