Estimated Value: $621,566 - $886,000
4
Beds
3
Baths
2,560
Sq Ft
$300/Sq Ft
Est. Value
About This Home
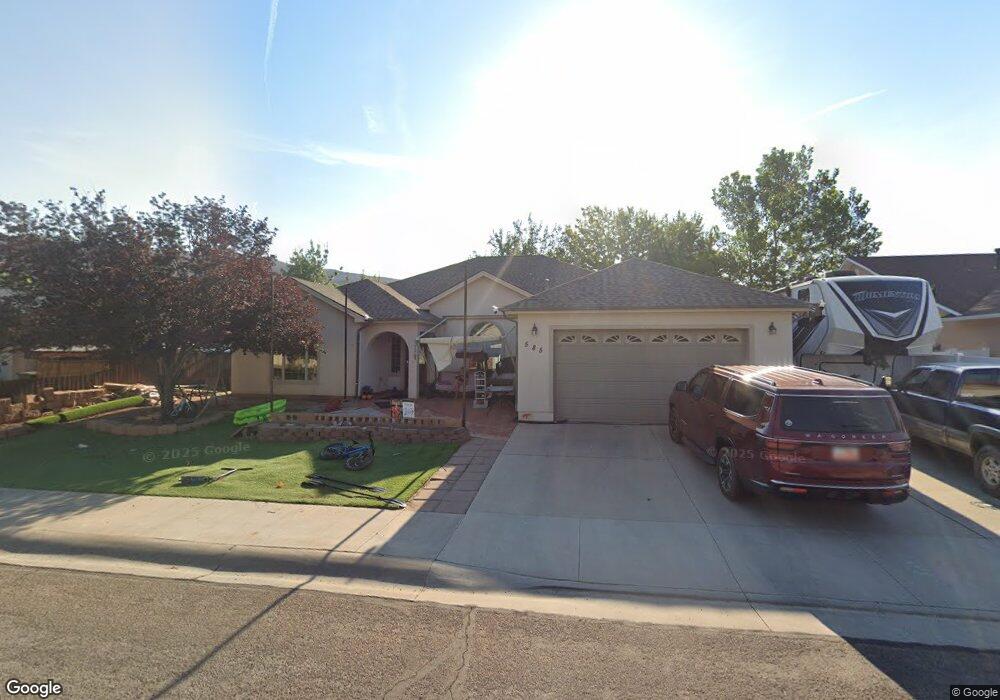
This home is located at 585 Jonny Way, Moab, UT 84532 and is currently estimated at $768,142, approximately $300 per square foot. 585 Jonny Way is a home located in Grand County with nearby schools including Helen M. Knight School, Grand County Middle School, and Grand County High School.
Ownership History
Date
Name
Owned For
Owner Type
Purchase Details
Closed on
Apr 24, 2009
Sold by
Haycock Richard E and Haycock Stephanie J
Bought by
Haycock Stephanie J and Eric Haycock R
Current Estimated Value
Purchase Details
Closed on
Aug 15, 2007
Sold by
Haycock Richard Eric and Haycock Stephanie J
Bought by
Haycock Haycock R and Haycock Stephanie J
Purchase Details
Closed on
Nov 13, 2006
Sold by
Horton Les
Bought by
Haycock Richard E and Haycock Stephanie J
Home Financials for this Owner
Home Financials are based on the most recent Mortgage that was taken out on this home.
Original Mortgage
$302,400
Interest Rate
6.36%
Mortgage Type
New Conventional
Create a Home Valuation Report for This Property
The Home Valuation Report is an in-depth analysis detailing your home's value as well as a comparison with similar homes in the area
Home Values in the Area
Average Home Value in this Area
Purchase History
| Date | Buyer | Sale Price | Title Company |
|---|---|---|---|
| Haycock Stephanie J | -- | -- | |
| Haycock Haycock R | -- | -- | |
| Haycock Richard E | -- | -- |
Source: Public Records
Mortgage History
| Date | Status | Borrower | Loan Amount |
|---|---|---|---|
| Previous Owner | Haycock Richard E | $302,400 |
Source: Public Records
Tax History
| Year | Tax Paid | Tax Assessment Tax Assessment Total Assessment is a certain percentage of the fair market value that is determined by local assessors to be the total taxable value of land and additions on the property. | Land | Improvement |
|---|---|---|---|---|
| 2025 | $3,929 | $677,797 | $75,000 | $602,797 |
| 2024 | $4,055 | $677,797 | $75,000 | $602,797 |
| 2023 | $3,412 | $677,797 | $75,000 | $602,797 |
| 2022 | $3,817 | $660,240 | $75,000 | $585,240 |
| 2021 | $757 | $373,771 | $70,000 | $303,771 |
| 2020 | $785 | $373,771 | $70,000 | $303,771 |
| 2019 | $2,185 | $373,771 | $70,000 | $303,771 |
| 2018 | $2,165 | $373,771 | $70,000 | $303,771 |
| 2017 | $850 | $0 | $0 | $0 |
| 2016 | $2,220 | $0 | $0 | $0 |
| 2015 | $2,180 | $0 | $0 | $0 |
| 2014 | $2,100 | $0 | $0 | $0 |
| 2013 | $2,071 | $200,200 | $0 | $0 |
Source: Public Records
Map
Nearby Homes
Your Personal Tour Guide
Ask me questions while you tour the home.