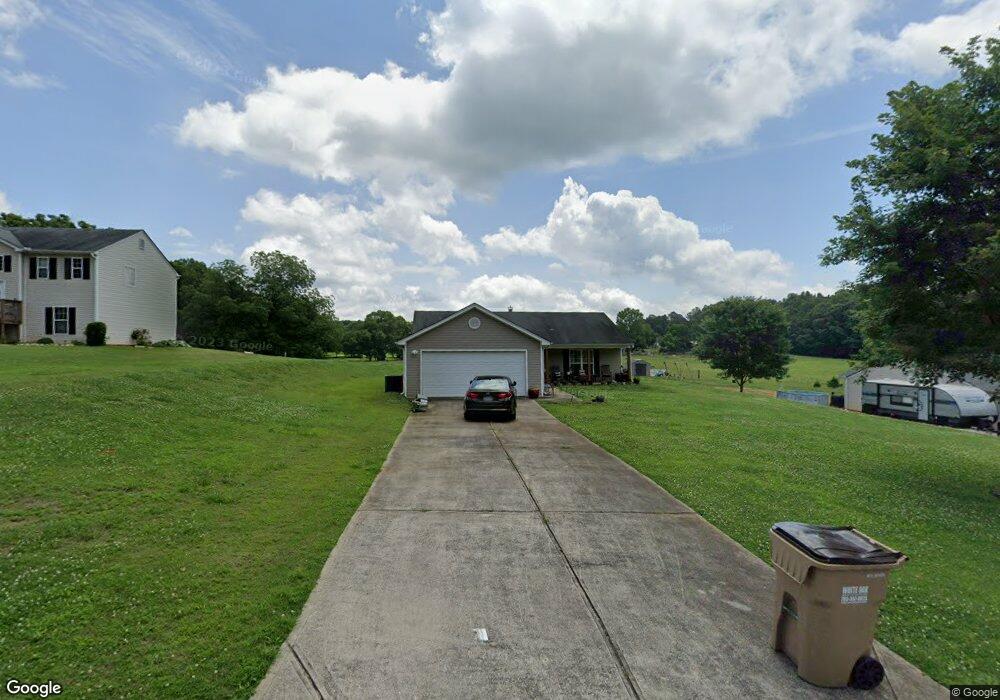
585 Kristin Ln Unit 1 Winder, GA 30680
Estimated Value: $270,000 - $317,000
3
Beds
2
Baths
1,428
Sq Ft
$203/Sq Ft
Est. Value
About This Home
This home is located at 585 Kristin Ln Unit 1, Winder, GA 30680 and is currently estimated at $290,107, approximately $203 per square foot. 585 Kristin Ln Unit 1 is a home located in Barrow County with nearby schools including Holsenbeck Elementary School, Bear Creek Middle School, and Winder-Barrow High School.
Ownership History
Date
Name
Owned For
Owner Type
Purchase Details
Closed on
Feb 18, 2021
Sold by
Scott Joyce
Bought by
Scott Joyce and Ellis Norton Chwanda
Current Estimated Value
Purchase Details
Closed on
Jul 27, 2006
Sold by
Southfork Hms Inc
Bought by
Scott Joyce and Norton Brett
Home Financials for this Owner
Home Financials are based on the most recent Mortgage that was taken out on this home.
Original Mortgage
$126,617
Interest Rate
9.75%
Mortgage Type
New Conventional
Purchase Details
Closed on
May 2, 2006
Sold by
Ledbetter and Sailors Developm
Bought by
Southfork Homes Inc
Purchase Details
Closed on
Oct 6, 2003
Bought by
Ledbetter And Sailors Development
Create a Home Valuation Report for This Property
The Home Valuation Report is an in-depth analysis detailing your home's value as well as a comparison with similar homes in the area
Home Values in the Area
Average Home Value in this Area
Purchase History
| Date | Buyer | Sale Price | Title Company |
|---|---|---|---|
| Scott Joyce | -- | -- | |
| Scott Joyce | $126,700 | -- | |
| Southfork Homes Inc | $39,000 | -- | |
| Ledbetter And Sailors Development | -- | -- |
Source: Public Records
Mortgage History
| Date | Status | Borrower | Loan Amount |
|---|---|---|---|
| Previous Owner | Scott Joyce | $126,617 |
Source: Public Records
Tax History Compared to Growth
Tax History
| Year | Tax Paid | Tax Assessment Tax Assessment Total Assessment is a certain percentage of the fair market value that is determined by local assessors to be the total taxable value of land and additions on the property. | Land | Improvement |
|---|---|---|---|---|
| 2024 | $2,011 | $80,741 | $16,000 | $64,741 |
| 2023 | $1,609 | $81,141 | $16,000 | $65,141 |
| 2022 | $1,963 | $68,634 | $16,000 | $52,634 |
| 2021 | $1,843 | $61,172 | $16,000 | $45,172 |
| 2020 | $1,787 | $59,306 | $16,000 | $43,306 |
| 2019 | $1,816 | $59,306 | $16,000 | $43,306 |
| 2018 | $1,747 | $57,838 | $10,800 | $47,038 |
| 2017 | $1,248 | $42,872 | $10,800 | $32,072 |
| 2016 | $1,180 | $40,309 | $10,800 | $29,509 |
| 2015 | $1,194 | $40,625 | $10,800 | $29,825 |
| 2014 | $1,115 | $37,786 | $7,644 | $30,142 |
| 2013 | -- | $36,292 | $7,644 | $28,648 |
Source: Public Records
Map
Nearby Homes
- 1212 Highway 211 NE
- 1226 Highway 211 NE
- 1553 Shoal Creek Dr
- 1556 Shoal Creek Dr
- 1206 Corkybrooke Ln
- 388 Kay Dr Unit 1
- 508 Pleasant Hill Church Rd NE
- 212 Rainbow Ln
- 917 Justin Dr Unit 3
- 385 Finch Landing Rd
- 0 Hancock Bridge Rd Unit 10535063
- 63 Delightful Way Unit 1
- 203 Delightful Way Unit 5
- 162 Delightful Way Unit 28
- 253 Delightful Way Unit 6
- 1431 Solomon Dr
- 281 Delightful Way Unit 7
- 230 Delightful Way Unit 23
- 330 Anchors Way
- 296 Delightful Way Unit 22
- 1359 Kristin Lane (6a)
- 583 Kristin Ln Unit 1 Lot17
- 583 Kristin Ln
- 587 Kristin Ln Unit 1
- 589 Kristin Ln
- 589 Kristin Ln Unit 1
- 581 Kristin Ln
- 584 Kristin Ln Unit 1
- 586 Kristin Ln Unit 23
- 586 Kristin Ln
- 582 Kristin Ln
- 588 Kristin Ln Unit 1
- 590 Kristin Ln Unit 1
- 579 Kristin Ln
- 580 Kristin Ln
- 578 Kristin Ln Unit 1
- 577 Kristin Ln Unit 14
- 577 Kristin Ln
- 1371 Lance Cir Unit 11
- 1371 Lance Cir