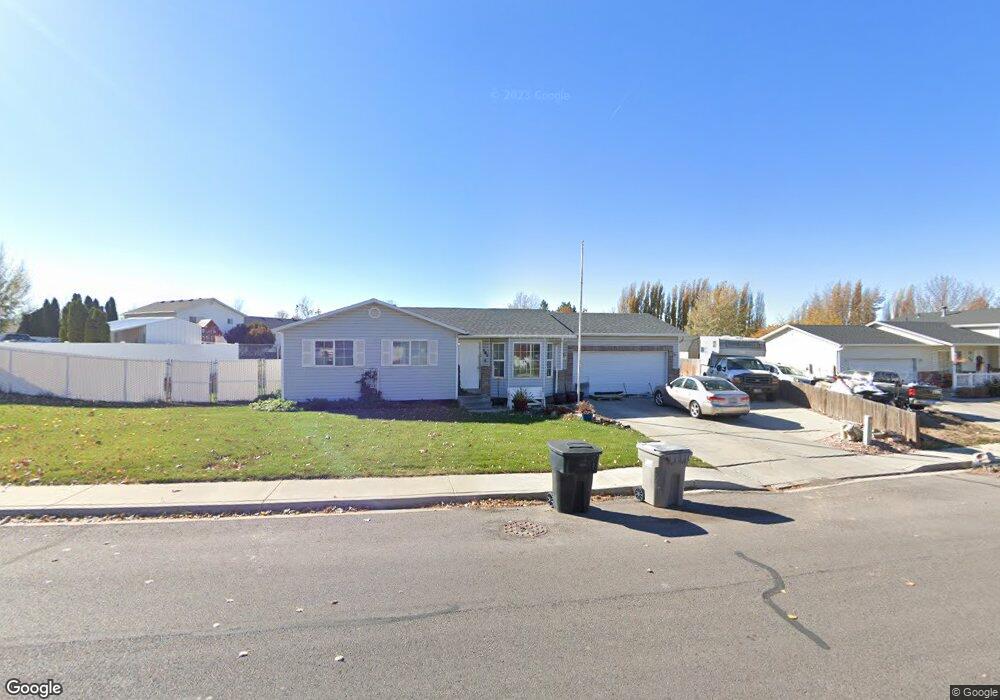
585 N 240 W Santaquin, UT 84655
Estimated Value: $434,000 - $461,000
3
Beds
2
Baths
1,108
Sq Ft
$400/Sq Ft
Est. Value
About This Home
This home is located at 585 N 240 W, Santaquin, UT 84655 and is currently estimated at $442,861, approximately $399 per square foot. 585 N 240 W is a home located in Utah County with nearby schools including Apple Valley Elementary, Payson Junior High School, and Payson High School.
Ownership History
Date
Name
Owned For
Owner Type
Purchase Details
Closed on
Apr 16, 2004
Sold by
Hopper Mark A and Hopper Joy A
Bought by
Hopper Mark A and Hopper Joy A
Current Estimated Value
Purchase Details
Closed on
Mar 18, 1999
Sold by
Salisbury Development Lc
Bought by
Hopper Mark A and Hopper Joy A
Home Financials for this Owner
Home Financials are based on the most recent Mortgage that was taken out on this home.
Original Mortgage
$107,925
Outstanding Balance
$26,076
Interest Rate
6.73%
Mortgage Type
Seller Take Back
Estimated Equity
$416,785
Create a Home Valuation Report for This Property
The Home Valuation Report is an in-depth analysis detailing your home's value as well as a comparison with similar homes in the area
Home Values in the Area
Average Home Value in this Area
Purchase History
| Date | Buyer | Sale Price | Title Company |
|---|---|---|---|
| Hopper Mark A | -- | Provo Land Title Co | |
| Hopper Mark A | -- | Provo Land Title Company |
Source: Public Records
Mortgage History
| Date | Status | Borrower | Loan Amount |
|---|---|---|---|
| Open | Hopper Mark A | $107,925 |
Source: Public Records
Tax History Compared to Growth
Tax History
| Year | Tax Paid | Tax Assessment Tax Assessment Total Assessment is a certain percentage of the fair market value that is determined by local assessors to be the total taxable value of land and additions on the property. | Land | Improvement |
|---|---|---|---|---|
| 2025 | $162 | $229,570 | $152,700 | $264,700 |
| 2024 | $162 | $205,205 | $0 | $0 |
| 2023 | $330 | $211,145 | $0 | $0 |
| 2022 | $539 | $229,845 | $0 | $0 |
| 2021 | $259 | $301,500 | $86,000 | $215,500 |
| 2020 | $843 | $280,000 | $74,800 | $205,200 |
| 2019 | $1,600 | $253,200 | $74,800 | $178,400 |
| 2018 | $1,461 | $220,500 | $65,400 | $155,100 |
| 2017 | $1,376 | $110,990 | $0 | $0 |
| 2016 | $1,279 | $101,035 | $0 | $0 |
| 2015 | $1,143 | $88,605 | $0 | $0 |
| 2014 | -- | $83,875 | $0 | $0 |
Source: Public Records
Map
Nearby Homes
- 162 W 690 N
- 600 N Center St
- 41 W 770 N
- 931 N 160 E Unit 11
- 931 N 160 E
- 921 N 160 E
- 921 N 160 E Unit 12
- 932 N 160 E Unit 21
- 922 N 160 E Unit 20
- 369 N 500 W Unit 3
- 951 N 215 W
- 949 N 215 W
- 947 N 215 W
- 953 N 215 W
- 931 N 215 W
- 358 W 910 N
- 894 N Apple Seed Ln
- 109 W 930 N
- 116 E 840 N
- McIntosh Plan at The Orchards