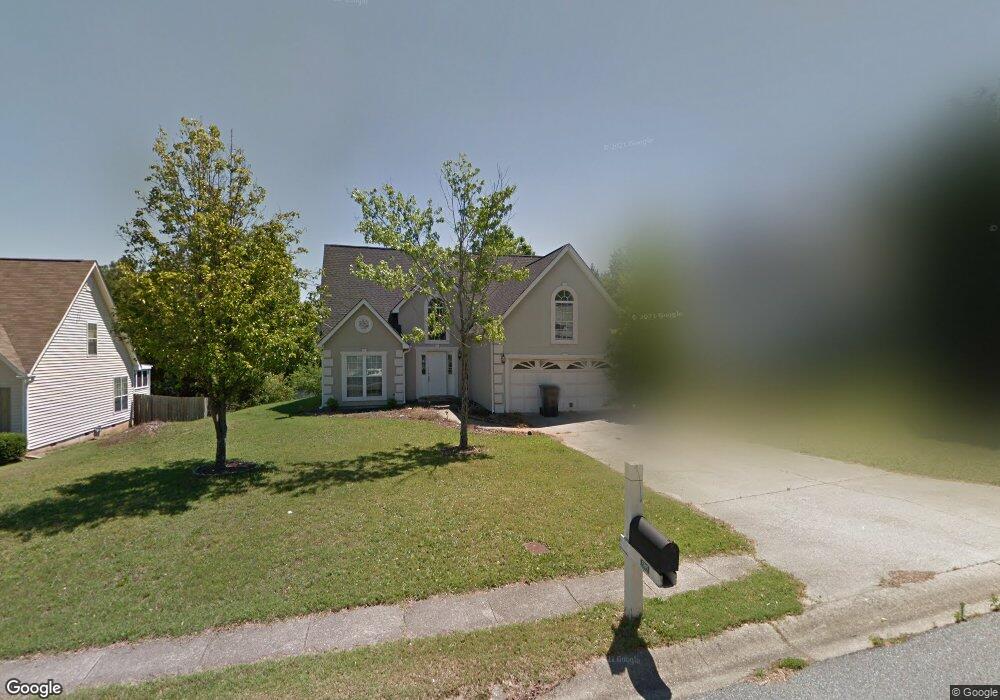
585 Old Johnson Rd Lawrenceville, GA 30045
Estimated Value: $345,000 - $363,000
3
Beds
3
Baths
1,903
Sq Ft
$185/Sq Ft
Est. Value
About This Home
This home is located at 585 Old Johnson Rd, Lawrenceville, GA 30045 and is currently estimated at $352,426, approximately $185 per square foot. 585 Old Johnson Rd is a home located in Gwinnett County with nearby schools including Starling Elementary School, Couch Middle School, and Grayson High School.
Ownership History
Date
Name
Owned For
Owner Type
Purchase Details
Closed on
Dec 1, 2015
Sold by
Little Matthew R
Bought by
American Homes 4 Rent Properties Eight L
Current Estimated Value
Purchase Details
Closed on
Jun 26, 2008
Sold by
Landaverde Jorge D and Landaverde Hyralda M
Bought by
Little Matthew R
Home Financials for this Owner
Home Financials are based on the most recent Mortgage that was taken out on this home.
Original Mortgage
$131,100
Interest Rate
5.97%
Mortgage Type
New Conventional
Purchase Details
Closed on
Dec 21, 2004
Sold by
Jones Bethaney L
Bought by
Landaverde Jorge D and Landaverde Hyralda
Home Financials for this Owner
Home Financials are based on the most recent Mortgage that was taken out on this home.
Original Mortgage
$160,730
Interest Rate
5.67%
Mortgage Type
VA
Purchase Details
Closed on
Nov 21, 1996
Sold by
Knight Dev Inc
Bought by
Jones Bethaney L and Rafferty William F
Create a Home Valuation Report for This Property
The Home Valuation Report is an in-depth analysis detailing your home's value as well as a comparison with similar homes in the area
Home Values in the Area
Average Home Value in this Area
Purchase History
| Date | Buyer | Sale Price | Title Company |
|---|---|---|---|
| American Homes 4 Rent Properties Eight L | $131,401 | -- | |
| Little Matthew R | $138,000 | -- | |
| Landaverde Jorge D | $162,000 | -- | |
| Jones Bethaney L | $125,900 | -- |
Source: Public Records
Mortgage History
| Date | Status | Borrower | Loan Amount |
|---|---|---|---|
| Previous Owner | Little Matthew R | $131,100 | |
| Previous Owner | Landaverde Jorge D | $160,730 | |
| Closed | Jones Bethaney L | $0 |
Source: Public Records
Tax History Compared to Growth
Tax History
| Year | Tax Paid | Tax Assessment Tax Assessment Total Assessment is a certain percentage of the fair market value that is determined by local assessors to be the total taxable value of land and additions on the property. | Land | Improvement |
|---|---|---|---|---|
| 2024 | $4,417 | $113,920 | $22,800 | $91,120 |
| 2023 | $4,417 | $113,920 | $22,800 | $91,120 |
| 2022 | $3,358 | $113,920 | $22,800 | $91,120 |
| 2021 | $3,395 | $85,040 | $18,400 | $66,640 |
| 2020 | $3,100 | $76,400 | $15,200 | $61,200 |
| 2019 | $2,646 | $66,640 | $15,200 | $51,440 |
| 2018 | $2,422 | $60,280 | $12,800 | $47,480 |
| 2016 | $2,242 | $54,640 | $10,800 | $43,840 |
| 2015 | $1,775 | $46,760 | $10,800 | $35,960 |
| 2014 | -- | $28,480 | $6,000 | $22,480 |
Source: Public Records
Map
Nearby Homes
- 595 Old Johnson Rd Unit 1
- 575 Old Johnson Rd
- 1225 Polaris Ct
- 605 Old Johnson Rd Unit 1
- 1215 Polaris Ct
- 1235 Polaris Ct Unit II
- 1155 Northfield Ln
- 1205 Polaris Ct
- 1150 Northfield Ln
- 600 Old Johnson Rd
- 1185 Polaris Ct Unit II
- 0 Polaris Ct Unit 7535891
- 0 Polaris Ct Unit 7147474
- 0 Polaris Ct Unit 8377457
- 0 Polaris Ct Unit 3230891
- 0 Polaris Ct Unit 7113722
- 0 Polaris Ct Unit 7218042
- 0 Polaris Ct Unit 7084303
- 0 Polaris Ct Unit 8678325
- 0 Polaris Ct Unit 8604213