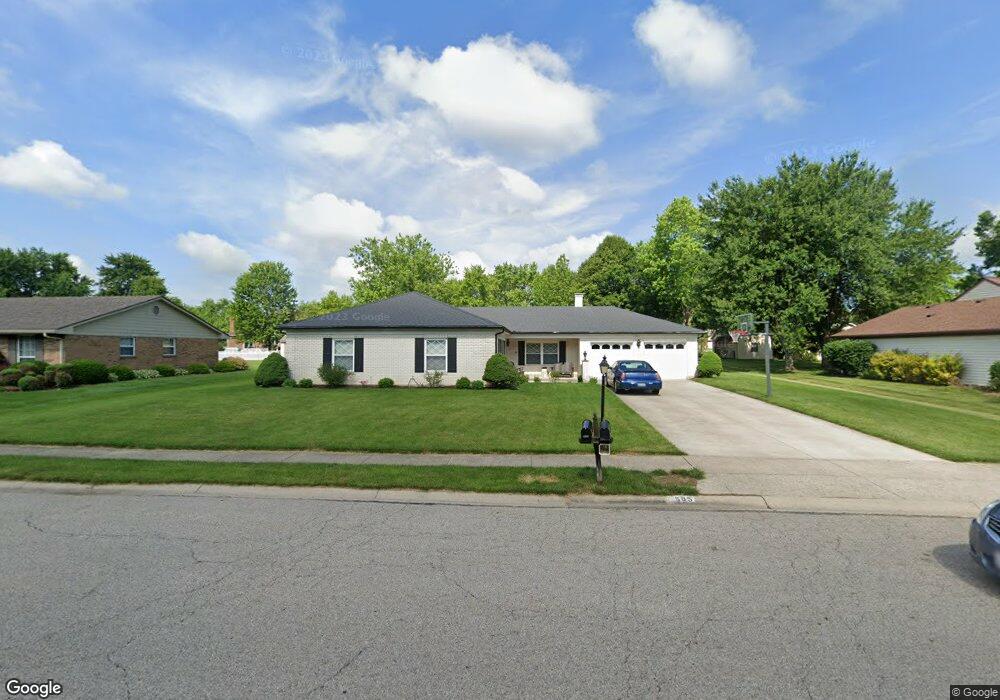
585 Queensgate Rd Springboro, OH 45066
Estimated Value: $351,430 - $376,000
4
Beds
2
Baths
2,104
Sq Ft
$175/Sq Ft
Est. Value
About This Home
This home is located at 585 Queensgate Rd, Springboro, OH 45066 and is currently estimated at $368,358, approximately $175 per square foot. 585 Queensgate Rd is a home located in Warren County with nearby schools including Clearcreek Elementary School, Springboro Intermediate School, and Dennis Elementary School.
Ownership History
Date
Name
Owned For
Owner Type
Purchase Details
Closed on
May 16, 2016
Sold by
Little Billy E
Bought by
Hatton Timothy
Current Estimated Value
Home Financials for this Owner
Home Financials are based on the most recent Mortgage that was taken out on this home.
Original Mortgage
$176,700
Outstanding Balance
$138,760
Interest Rate
3.58%
Mortgage Type
New Conventional
Estimated Equity
$229,598
Purchase Details
Closed on
Mar 11, 2013
Sold by
Wilson Alvis D and Little Alvis D
Bought by
Little Billy E and Little Alvis D
Purchase Details
Closed on
Oct 5, 2011
Sold by
Wilson Alvis D and Little Alvis D
Bought by
Wilson Alvis D and Little Alvis D
Purchase Details
Closed on
May 20, 1994
Sold by
Wilson Alvis D and Wilson Alvis D
Bought by
Wilson & Alvis D. Trustee
Purchase Details
Closed on
Apr 22, 1992
Sold by
Wilson Ralph W and Wilson Alvis
Bought by
Wilson and Wilson Alvis D
Purchase Details
Closed on
Nov 7, 1979
Sold by
Rutmann Brothers Inc
Purchase Details
Closed on
Jul 25, 1978
Sold by
Lsm Corp
Create a Home Valuation Report for This Property
The Home Valuation Report is an in-depth analysis detailing your home's value as well as a comparison with similar homes in the area
Home Values in the Area
Average Home Value in this Area
Purchase History
| Date | Buyer | Sale Price | Title Company |
|---|---|---|---|
| Hatton Timothy | -- | Attorney | |
| Little Billy E | -- | None Available | |
| Wilson Alvis D | -- | None Available | |
| Wilson & Alvis D. Trustee | -- | -- | |
| Wilson | -- | -- | |
| -- | $77,900 | -- | |
| -- | -- | -- |
Source: Public Records
Mortgage History
| Date | Status | Borrower | Loan Amount |
|---|---|---|---|
| Open | Hatton Timothy | $176,700 |
Source: Public Records
Tax History
| Year | Tax Paid | Tax Assessment Tax Assessment Total Assessment is a certain percentage of the fair market value that is determined by local assessors to be the total taxable value of land and additions on the property. | Land | Improvement |
|---|---|---|---|---|
| 2025 | $4,016 | $102,850 | $31,500 | $71,350 |
| 2024 | $4,016 | $102,850 | $31,500 | $71,350 |
| 2023 | $3,377 | $79,296 | $16,940 | $62,356 |
| 2022 | $3,327 | $79,296 | $16,940 | $62,356 |
| 2021 | $3,172 | $79,296 | $16,940 | $62,356 |
| 2020 | $3,002 | $65,534 | $14,000 | $51,534 |
| 2019 | $2,774 | $65,534 | $14,000 | $51,534 |
| 2018 | $2,776 | $65,534 | $14,000 | $51,534 |
| 2017 | $2,655 | $56,455 | $12,250 | $44,205 |
| 2016 | $2,276 | $56,455 | $12,250 | $44,205 |
| 2015 | $2,281 | $56,455 | $12,250 | $44,205 |
| 2014 | $2,221 | $52,760 | $11,450 | $41,310 |
| 2013 | $2,220 | $64,520 | $14,000 | $50,520 |
Source: Public Records
Map
Nearby Homes
- 1101 Parklake Row
- 340 Saint James Place
- 350 Spruceway Dr
- 1785 Archerfield Place
- 11138 Oakwood Village Blvd
- 23 Pheasant Run Cir Unit 9A
- 245 Whispering Pines St
- 10862 Jandor Place
- 9680 Williams Dr
- 50 Millard Ct
- 225 Renwood Place
- 92 Villa Pointe Dr Unit 92
- 4193 Old Osprey Cir
- 25 Blose Ct
- 3461 Myna Ln
- 1315 Woodland Greens Blvd
- 365 Crockett Dr
- 25 Glass Ct
- 10024 Oriole Ct
- 80 Gregg Ct
- 595 Queensgate Rd
- 575 Queensgate Rd
- 580 Royal Springs Dr
- 590 Royal Springs Dr
- 605 Queensgate Rd
- 565 Queensgate Rd
- 580 Queensgate Rd
- 570 Royal Springs Dr
- 600 Royal Springs Dr
- 590 Queensgate Rd
- 570 Queensgate Rd
- 600 Queensgate Rd
- 555 Queensgate Rd
- 610 Royal Springs Dr
- 615 Queensgate Rd
- 560 Royal Springs Dr
- 560 Queensgate Rd
- 610 Queensgate Rd
- 585 Royal Springs Dr
- 595 Royal Springs Dr
Your Personal Tour Guide
Ask me questions while you tour the home.