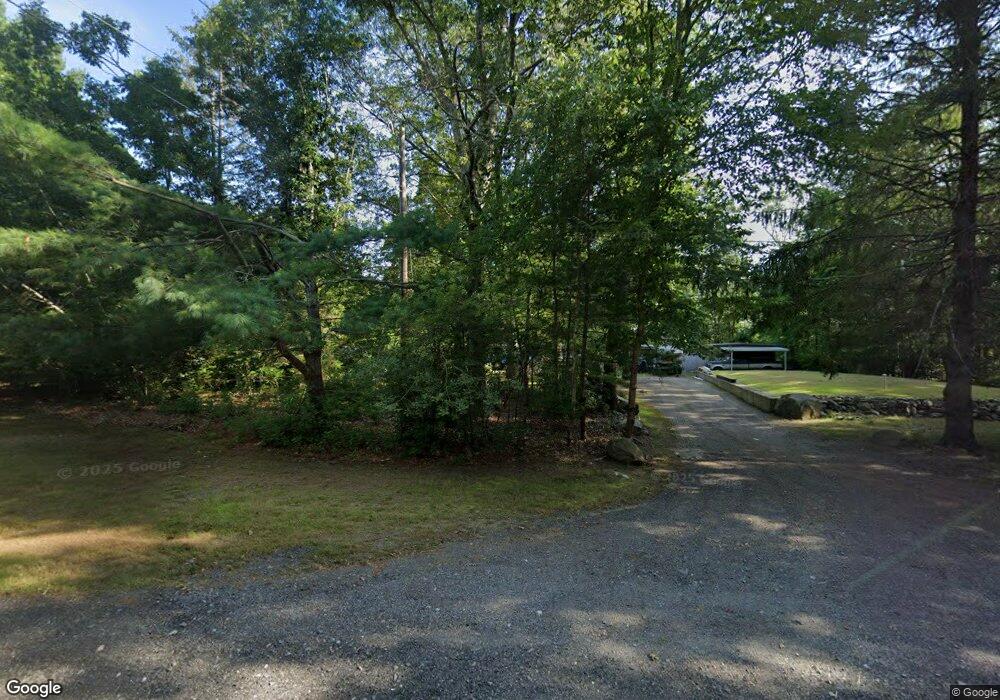
585 Tremont St Rehoboth, MA 02769
Estimated Value: $353,000 - $484,000
3
Beds
1
Bath
1,527
Sq Ft
$288/Sq Ft
Est. Value
About This Home
This home is located at 585 Tremont St, Rehoboth, MA 02769 and is currently estimated at $440,290, approximately $288 per square foot. 585 Tremont St is a home located in Bristol County with nearby schools including Dighton-Rehoboth Regional High School, Grace Baptist Christian Academy, and St Cecilia School.
Ownership History
Date
Name
Owned For
Owner Type
Purchase Details
Closed on
Jul 7, 2016
Sold by
Charpentier-Anzevino Ana
Bought by
Soares Carlos A and Charpentier-Anzevino Ana
Current Estimated Value
Purchase Details
Closed on
Aug 9, 2013
Sold by
Soares Carlos A
Bought by
Anzevino Ana C
Purchase Details
Closed on
Feb 23, 2012
Sold by
Soares Maria P
Bought by
Soares Carlos A
Purchase Details
Closed on
Sep 13, 2010
Sold by
Est Corriveau Peter J and Deschenes Marc Exor
Bought by
Soares Carlos A and Soares Maria P
Create a Home Valuation Report for This Property
The Home Valuation Report is an in-depth analysis detailing your home's value as well as a comparison with similar homes in the area
Home Values in the Area
Average Home Value in this Area
Purchase History
| Date | Buyer | Sale Price | Title Company |
|---|---|---|---|
| Soares Carlos A | -- | -- | |
| Anzevino Ana C | -- | -- | |
| Soares Carlos A | -- | -- | |
| Soares Carlos A | $100,000 | -- |
Source: Public Records
Mortgage History
| Date | Status | Borrower | Loan Amount |
|---|---|---|---|
| Previous Owner | Soares Carlos A | $42,000 | |
| Previous Owner | Soares Carlos A | $49,200 |
Source: Public Records
Tax History Compared to Growth
Tax History
| Year | Tax Paid | Tax Assessment Tax Assessment Total Assessment is a certain percentage of the fair market value that is determined by local assessors to be the total taxable value of land and additions on the property. | Land | Improvement |
|---|---|---|---|---|
| 2025 | $35 | $311,300 | $166,500 | $144,800 |
| 2024 | $3,301 | $290,600 | $149,800 | $140,800 |
| 2023 | $3,230 | $278,900 | $147,000 | $131,900 |
| 2022 | $3,251 | $256,600 | $147,000 | $109,600 |
| 2021 | $3,130 | $236,400 | $132,100 | $104,300 |
| 2020 | $2,789 | $212,600 | $116,600 | $96,000 |
| 2018 | $2,627 | $219,500 | $125,800 | $93,700 |
| 2017 | $2,582 | $205,600 | $133,200 | $72,400 |
| 2016 | $2,437 | $200,600 | $125,800 | $74,800 |
| 2015 | $2,396 | $194,600 | $126,800 | $67,800 |
| 2014 | $2,346 | $188,600 | $120,800 | $67,800 |
Source: Public Records
Map
Nearby Homes
- 581 Tremont St
- 593 Tremont St
- 577 Tremont St
- 588 Tremont St
- 597 Tremont St
- 580 Tremont St
- 574 Tremont St
- 575 Tremont St
- 584 Tremont St
- 592 Tremont St
- 579 Tremont St
- 599 Tremont St
- 596 Tremont St
- 7 Finnegans Way
- 570 Tremont St
- 567 Tremont St
- 568 Tremont St
- 566 Tremont St
- 601 Tremont St
- 565 Tremont St
