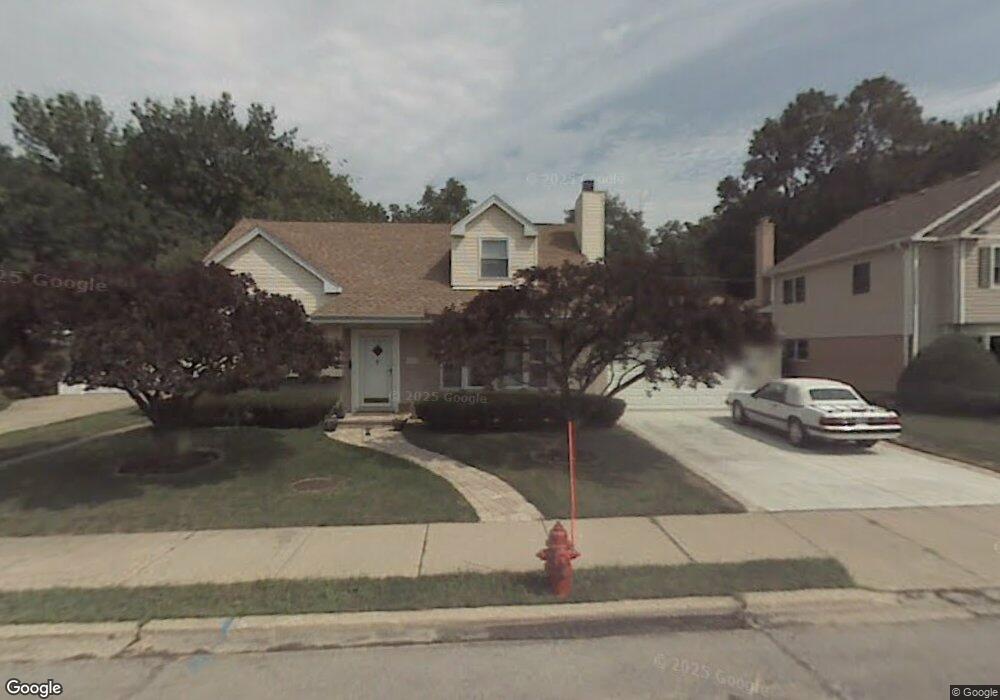
5850 Capri Ln Morton Grove, IL 60053
Estimated Value: $476,000 - $564,000
3
Beds
2
Baths
2,014
Sq Ft
$265/Sq Ft
Est. Value
About This Home
This home is located at 5850 Capri Ln, Morton Grove, IL 60053 and is currently estimated at $533,395, approximately $264 per square foot. 5850 Capri Ln is a home located in Cook County with nearby schools including Hynes Elementary School, Golf Middle School, and Niles North High School.
Ownership History
Date
Name
Owned For
Owner Type
Purchase Details
Closed on
Oct 9, 2020
Sold by
Matusik Cindy and Sydor Cindy
Bought by
Matusik Matthew
Current Estimated Value
Home Financials for this Owner
Home Financials are based on the most recent Mortgage that was taken out on this home.
Original Mortgage
$148,000
Outstanding Balance
$130,339
Interest Rate
2.37%
Mortgage Type
New Conventional
Estimated Equity
$403,056
Purchase Details
Closed on
Jun 21, 2008
Sold by
Matusik Matthew J and Matusik Cindy
Bought by
Matusik Matthew J and Matusik Cindy
Purchase Details
Closed on
Jan 7, 2004
Sold by
Neustadter David W and Neustadter Barbara M
Bought by
Matusik Matthew J and Sydor Cindy
Home Financials for this Owner
Home Financials are based on the most recent Mortgage that was taken out on this home.
Original Mortgage
$303,200
Interest Rate
5.94%
Mortgage Type
Unknown
Create a Home Valuation Report for This Property
The Home Valuation Report is an in-depth analysis detailing your home's value as well as a comparison with similar homes in the area
Home Values in the Area
Average Home Value in this Area
Purchase History
| Date | Buyer | Sale Price | Title Company |
|---|---|---|---|
| Matusik Matthew | -- | Premier Title | |
| Matusik Matthew J | -- | None Available | |
| Matusik Matthew J | $379,000 | Centennial Title Incorporate |
Source: Public Records
Mortgage History
| Date | Status | Borrower | Loan Amount |
|---|---|---|---|
| Open | Matusik Matthew | $148,000 | |
| Closed | Matusik Matthew J | $303,200 |
Source: Public Records
Tax History Compared to Growth
Tax History
| Year | Tax Paid | Tax Assessment Tax Assessment Total Assessment is a certain percentage of the fair market value that is determined by local assessors to be the total taxable value of land and additions on the property. | Land | Improvement |
|---|---|---|---|---|
| 2024 | $10,165 | $40,685 | $9,750 | $30,935 |
| 2023 | $9,685 | $40,685 | $9,750 | $30,935 |
| 2022 | $9,685 | $40,685 | $9,750 | $30,935 |
| 2021 | $7,978 | $30,272 | $6,000 | $24,272 |
| 2020 | $7,901 | $30,272 | $6,000 | $24,272 |
| 2019 | $7,990 | $34,014 | $6,000 | $28,014 |
| 2018 | $8,641 | $33,144 | $5,437 | $27,707 |
| 2017 | $8,691 | $33,144 | $5,437 | $27,707 |
| 2016 | $8,462 | $33,144 | $5,437 | $27,707 |
| 2015 | $8,643 | $31,172 | $4,687 | $26,485 |
| 2014 | $8,493 | $31,172 | $4,687 | $26,485 |
| 2013 | $8,329 | $31,172 | $4,687 | $26,485 |
Source: Public Records
Map
Nearby Homes
- 9320 Menard Ave
- 9314 Menard Ave
- 9224 Menard Ave
- 5644 Lyons St
- 9234 Central Ave
- 5449 Arcadia St
- 8918 Parkside Ave
- 9539 Lorel Ave
- 8841 Menard Ave
- 8836 Mansfield Ave
- 8849 Mcvicker Ave
- 5536 Greenwood St
- 9655 Woods Dr Unit 1809
- 9655 Woods Dr Unit P350
- 9715 Woods Dr Unit 1104
- 9715 Woods Dr Unit 903
- 9725 Woods Dr Unit 1913
- 9725 Woods Dr Unit 802
- 9725 Woods Dr Unit 309
- 9725 Woods Dr Unit 2015
- 5904 Capri Ln
- 5844 Capri Ln
- 5849 Capri Ln
- 5838 Capri Ln
- 5843 Capri Ln
- 5903 Capri Ln
- 5908 Capri Ln
- 5832 Capri Ln
- 9422 Marmora Ave
- 5850 Emerson St
- 5850 Emerson St
- 5831 Capri Ln
- 9416 Marmora Ave
- 5844 Emerson St
- 5826 Capri Ln
- 5838 Emerson St
- 5838 Emerson St
- 9410 Marmora Ave
- 5825 Capri Ln
- 5832 Emerson St