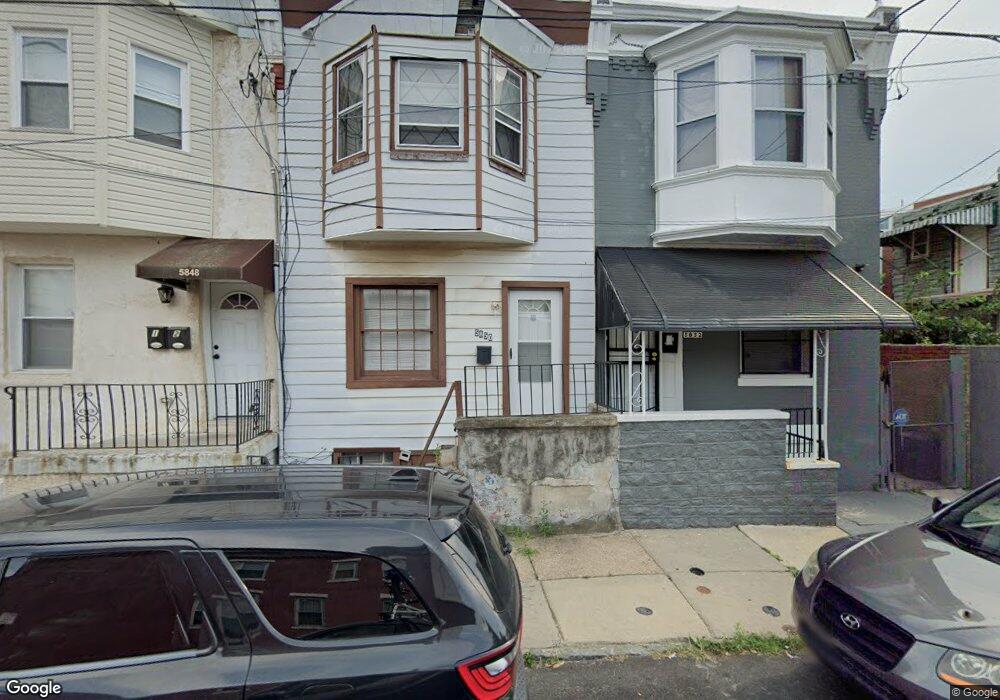
5850 Filbert St Philadelphia, PA 19139
Haddington NeighborhoodEstimated Value: $124,000 - $153,000
3
Beds
1
Bath
1,176
Sq Ft
$119/Sq Ft
Est. Value
About This Home
This home is located at 5850 Filbert St, Philadelphia, PA 19139 and is currently estimated at $140,077, approximately $119 per square foot. 5850 Filbert St is a home located in Philadelphia County with nearby schools including John Barry Elementary School, William L. Sayre High School, and Philadelphia Christian Academy.
Ownership History
Date
Name
Owned For
Owner Type
Purchase Details
Closed on
May 24, 2007
Sold by
Burose Micheal and Burose Michael
Bought by
Bowie Tyrell
Current Estimated Value
Home Financials for this Owner
Home Financials are based on the most recent Mortgage that was taken out on this home.
Original Mortgage
$66,949
Outstanding Balance
$40,767
Interest Rate
6.19%
Mortgage Type
FHA
Estimated Equity
$99,310
Purchase Details
Closed on
Oct 28, 2002
Sold by
Benbow Franklin and Wachovia Bank Na
Bought by
Burose Michael
Create a Home Valuation Report for This Property
The Home Valuation Report is an in-depth analysis detailing your home's value as well as a comparison with similar homes in the area
Home Values in the Area
Average Home Value in this Area
Purchase History
| Date | Buyer | Sale Price | Title Company |
|---|---|---|---|
| Bowie Tyrell | $68,000 | None Available | |
| Burose Michael | $10,500 | -- |
Source: Public Records
Mortgage History
| Date | Status | Borrower | Loan Amount |
|---|---|---|---|
| Open | Bowie Tyrell | $66,949 |
Source: Public Records
Tax History Compared to Growth
Tax History
| Year | Tax Paid | Tax Assessment Tax Assessment Total Assessment is a certain percentage of the fair market value that is determined by local assessors to be the total taxable value of land and additions on the property. | Land | Improvement |
|---|---|---|---|---|
| 2025 | $904 | $100,900 | $20,180 | $80,720 |
| 2024 | $904 | $100,900 | $20,180 | $80,720 |
| 2023 | $904 | $64,600 | $12,920 | $51,680 |
| 2022 | $274 | $19,600 | $12,920 | $6,680 |
| 2021 | $904 | $0 | $0 | $0 |
| 2020 | $904 | $0 | $0 | $0 |
| 2019 | $871 | $0 | $0 | $0 |
| 2018 | $371 | $0 | $0 | $0 |
| 2017 | $791 | $0 | $0 | $0 |
| 2016 | $371 | $0 | $0 | $0 |
| 2015 | $52 | $0 | $0 | $0 |
| 2014 | -- | $33,900 | $2,794 | $31,106 |
| 2012 | -- | $5,440 | $1,088 | $4,352 |
Source: Public Records
Map
Nearby Homes